Redis Deadlock Problem Caused by Stream Data Read and Write (1)
In the Redis project, an issue named “[BUG] Deadlock with streams on redis 7.2” issue 12290 caught my attention. In this bug, the Redis server gets stuck in an infinite loop while processing specific client requests, which is extremely rare in a high-performance, high-reliability database system like Redis.
This issue is not just an ordinary bug report; it’s actually a learning process that deeply explores Redis’s internal mechanisms. From the discovery of the problem, to the detailed description of reproduction steps, to in-depth analysis of the issue, and finally to the proposal of solutions, each step is full of challenges and discoveries. Whether you’re a Redis user or a developer interested in the internal mechanisms of databases, I believe you can gain valuable insights from this issue.
Before we start investigating this bug, let’s briefly understand the background knowledge here: Redis’s stream data type.
Introduction to Redis streams
To support more powerful and flexible stream processing capabilities, Redis introduced stream data type in version 5.0, including XADD, XREAD, and XREADGROUP.
- The
XADDcommand allows users to add new messages to a Redis stream. Each message has a unique ID and a set of field-value pairs. This data structure is very suitable for representing time series data, such as logs, sensor readings, etc. Through XADD, users can store this data in Redis and then query and process it using other commands. - The
XREADcommand is used to read data from one or more streams. You can specify where to start reading from each stream and how many messages to read at most. This command is suitable for simple stream processing scenarios, for example, when you only need to read data from the stream without tracking the progress of reading. - The
XREADGROUPcommand is part of Redis’s consumer group functionality. Consumer groups allow multiple consumers to share access to the same stream while tracking the progress of each consumer. This functionality is very useful for building scalable stream processing systems. For example, you can have multiple consumers reading from the same stream simultaneously, with each consumer processing a portion of the messages in the stream. Through XREADGROUP, each consumer can remember where it has read up to, so it can start from the correct position the next time it reads.
We can use the XREADGROUP command to read data from a specific stream. If there is no new data in this stream currently, the client issuing the XREADGROUP command will enter a blocking wait state until there is new data in the stream. Similarly, we can use the XADD command to add new data to the stream. When new data is added to the stream, all clients “waiting” on this stream will be awakened and then start processing the new data.
Note that the “waiting” here is not the kind of blocking that stops the entire server as we usually understand it. In fact, only the client that issued the XREADGROUP command will enter the “waiting” state, while the Redis server can continue to process requests from other clients. This means that even if some clients are waiting for new data, the Redis server can maintain efficient operation.
For more information, please refer to the Redis official documentation: Redis Streams tutorial.
Bug Reproduction
Alright, now we can delve into this bug. Let’s first look at the reproduction script. There are two scripts in total, one consumer subscriber and one publisher, where:
- subscriber.py: This script creates a group of subscribers, each of which tries to create a task queue named ‘test’ and continuously reads new streams from that queue. If there are no new streams, the subscriber will pause for 5 seconds and then continue trying to read. If a new stream is read, the subscriber will print out the new stream. This script will continue to run until all subscriber processes end.
- feeder.py: This script adds new tasks to the same task queue. It creates a group of publishers, each of which will add new tasks to the task queue and pause for 0.1 seconds after each task addition. This script will continue to run until all publisher processes end.
The code for subscriber.py is as follows:
1 | import time |
The code for feeder.py is as follows:
1 | import time |
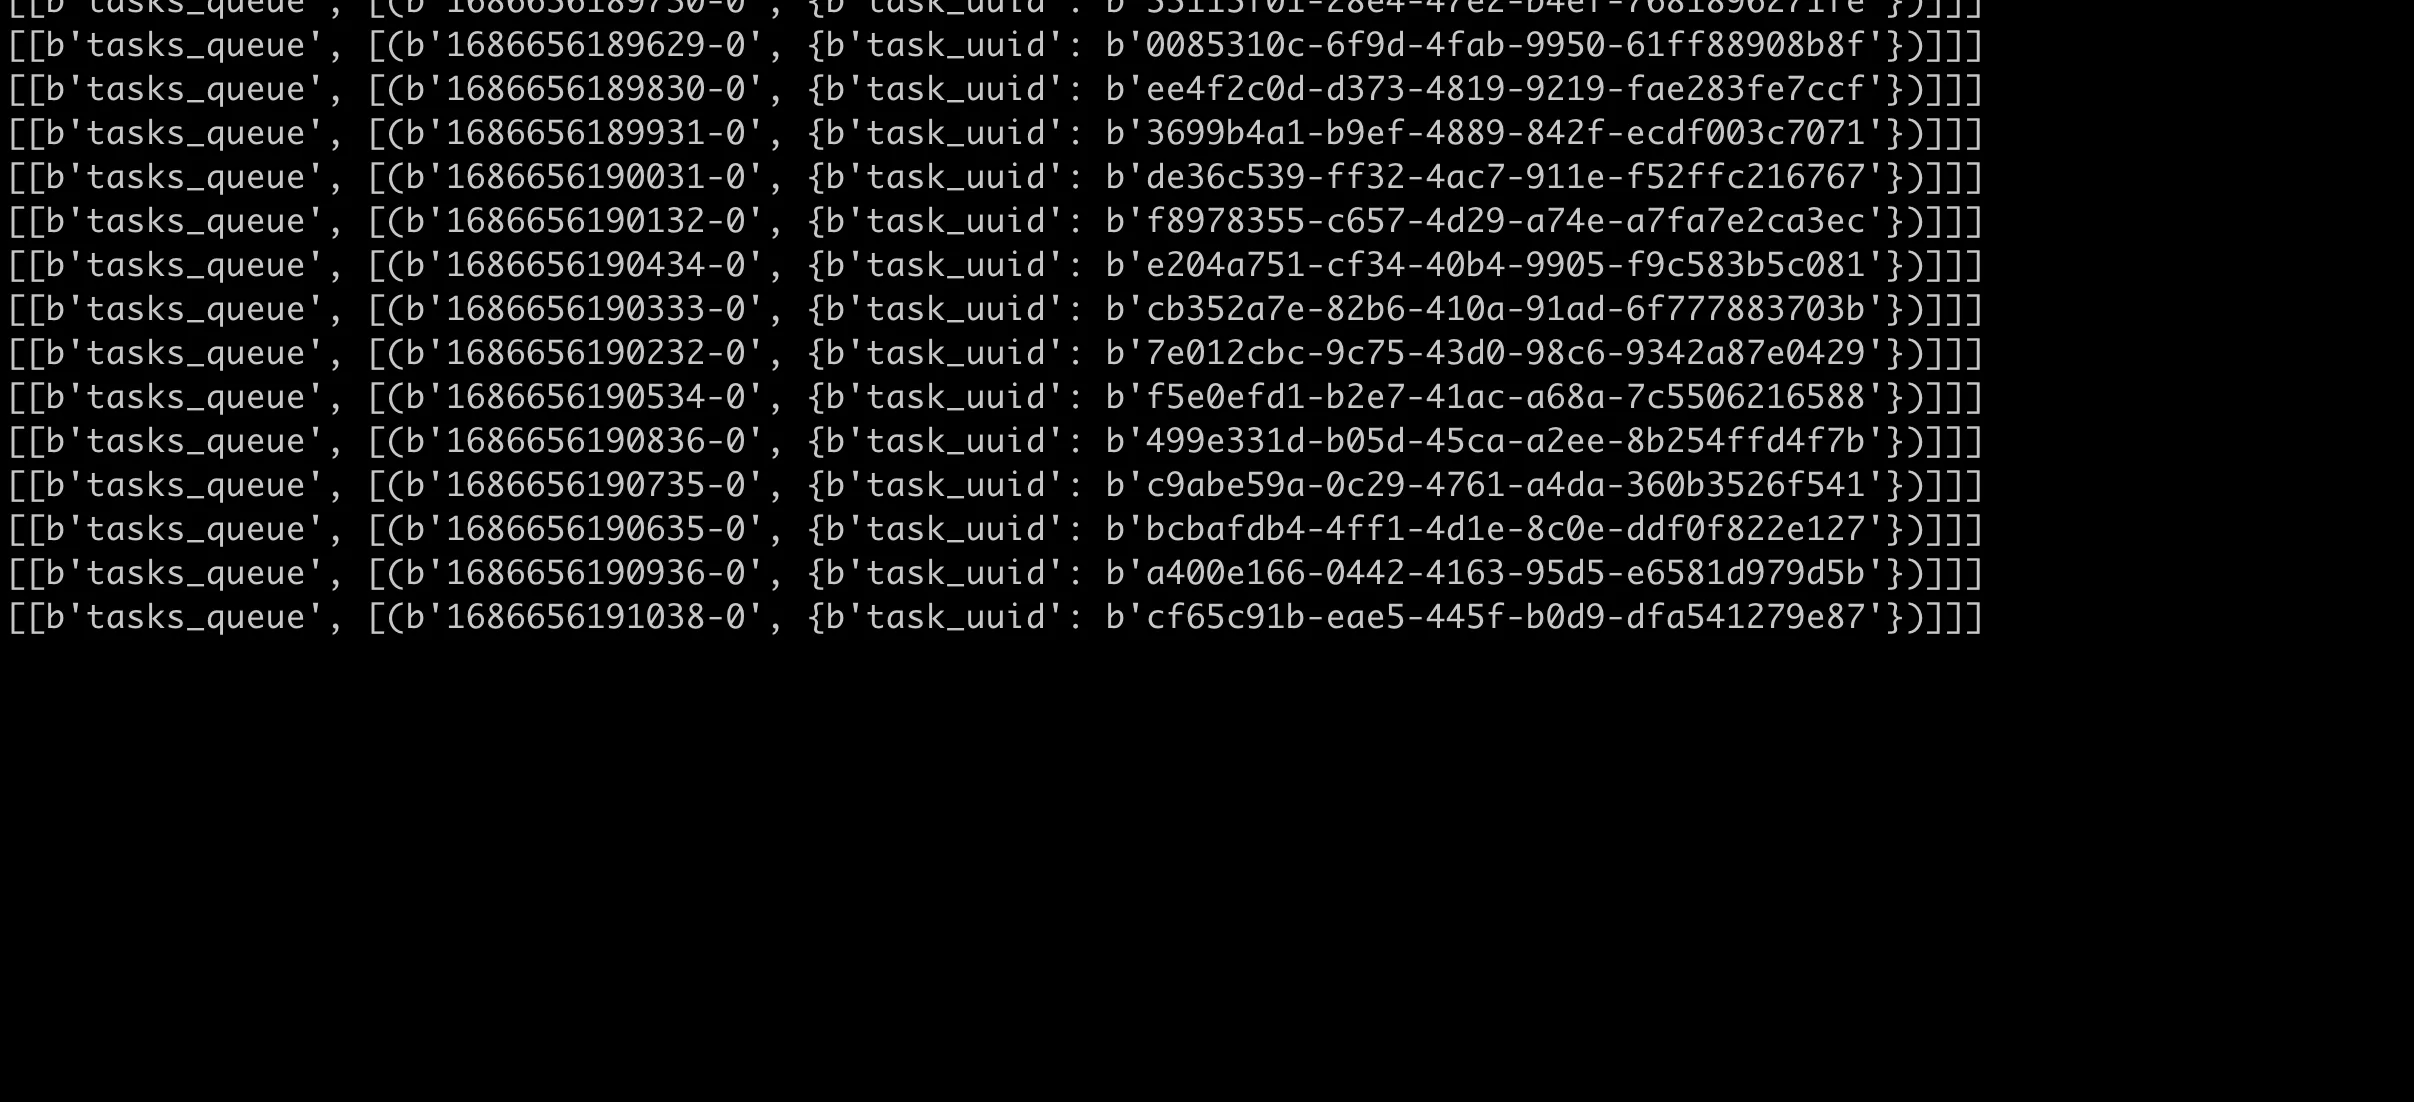
Note that the unix_socket_path here needs to be changed to the socket path configured by your own server. We first start the publisher feeder.py to write data to the stream, and then use subscriber.py to consume the stream. The expected normal behavior (which is the behavior on Redis server v=7.0.8) is that the subscriber will continuously retrieve the data written to the stream by the feeder, while Redis can still respond to requests from other clients, and the CPU usage of the server is at a reasonable level.
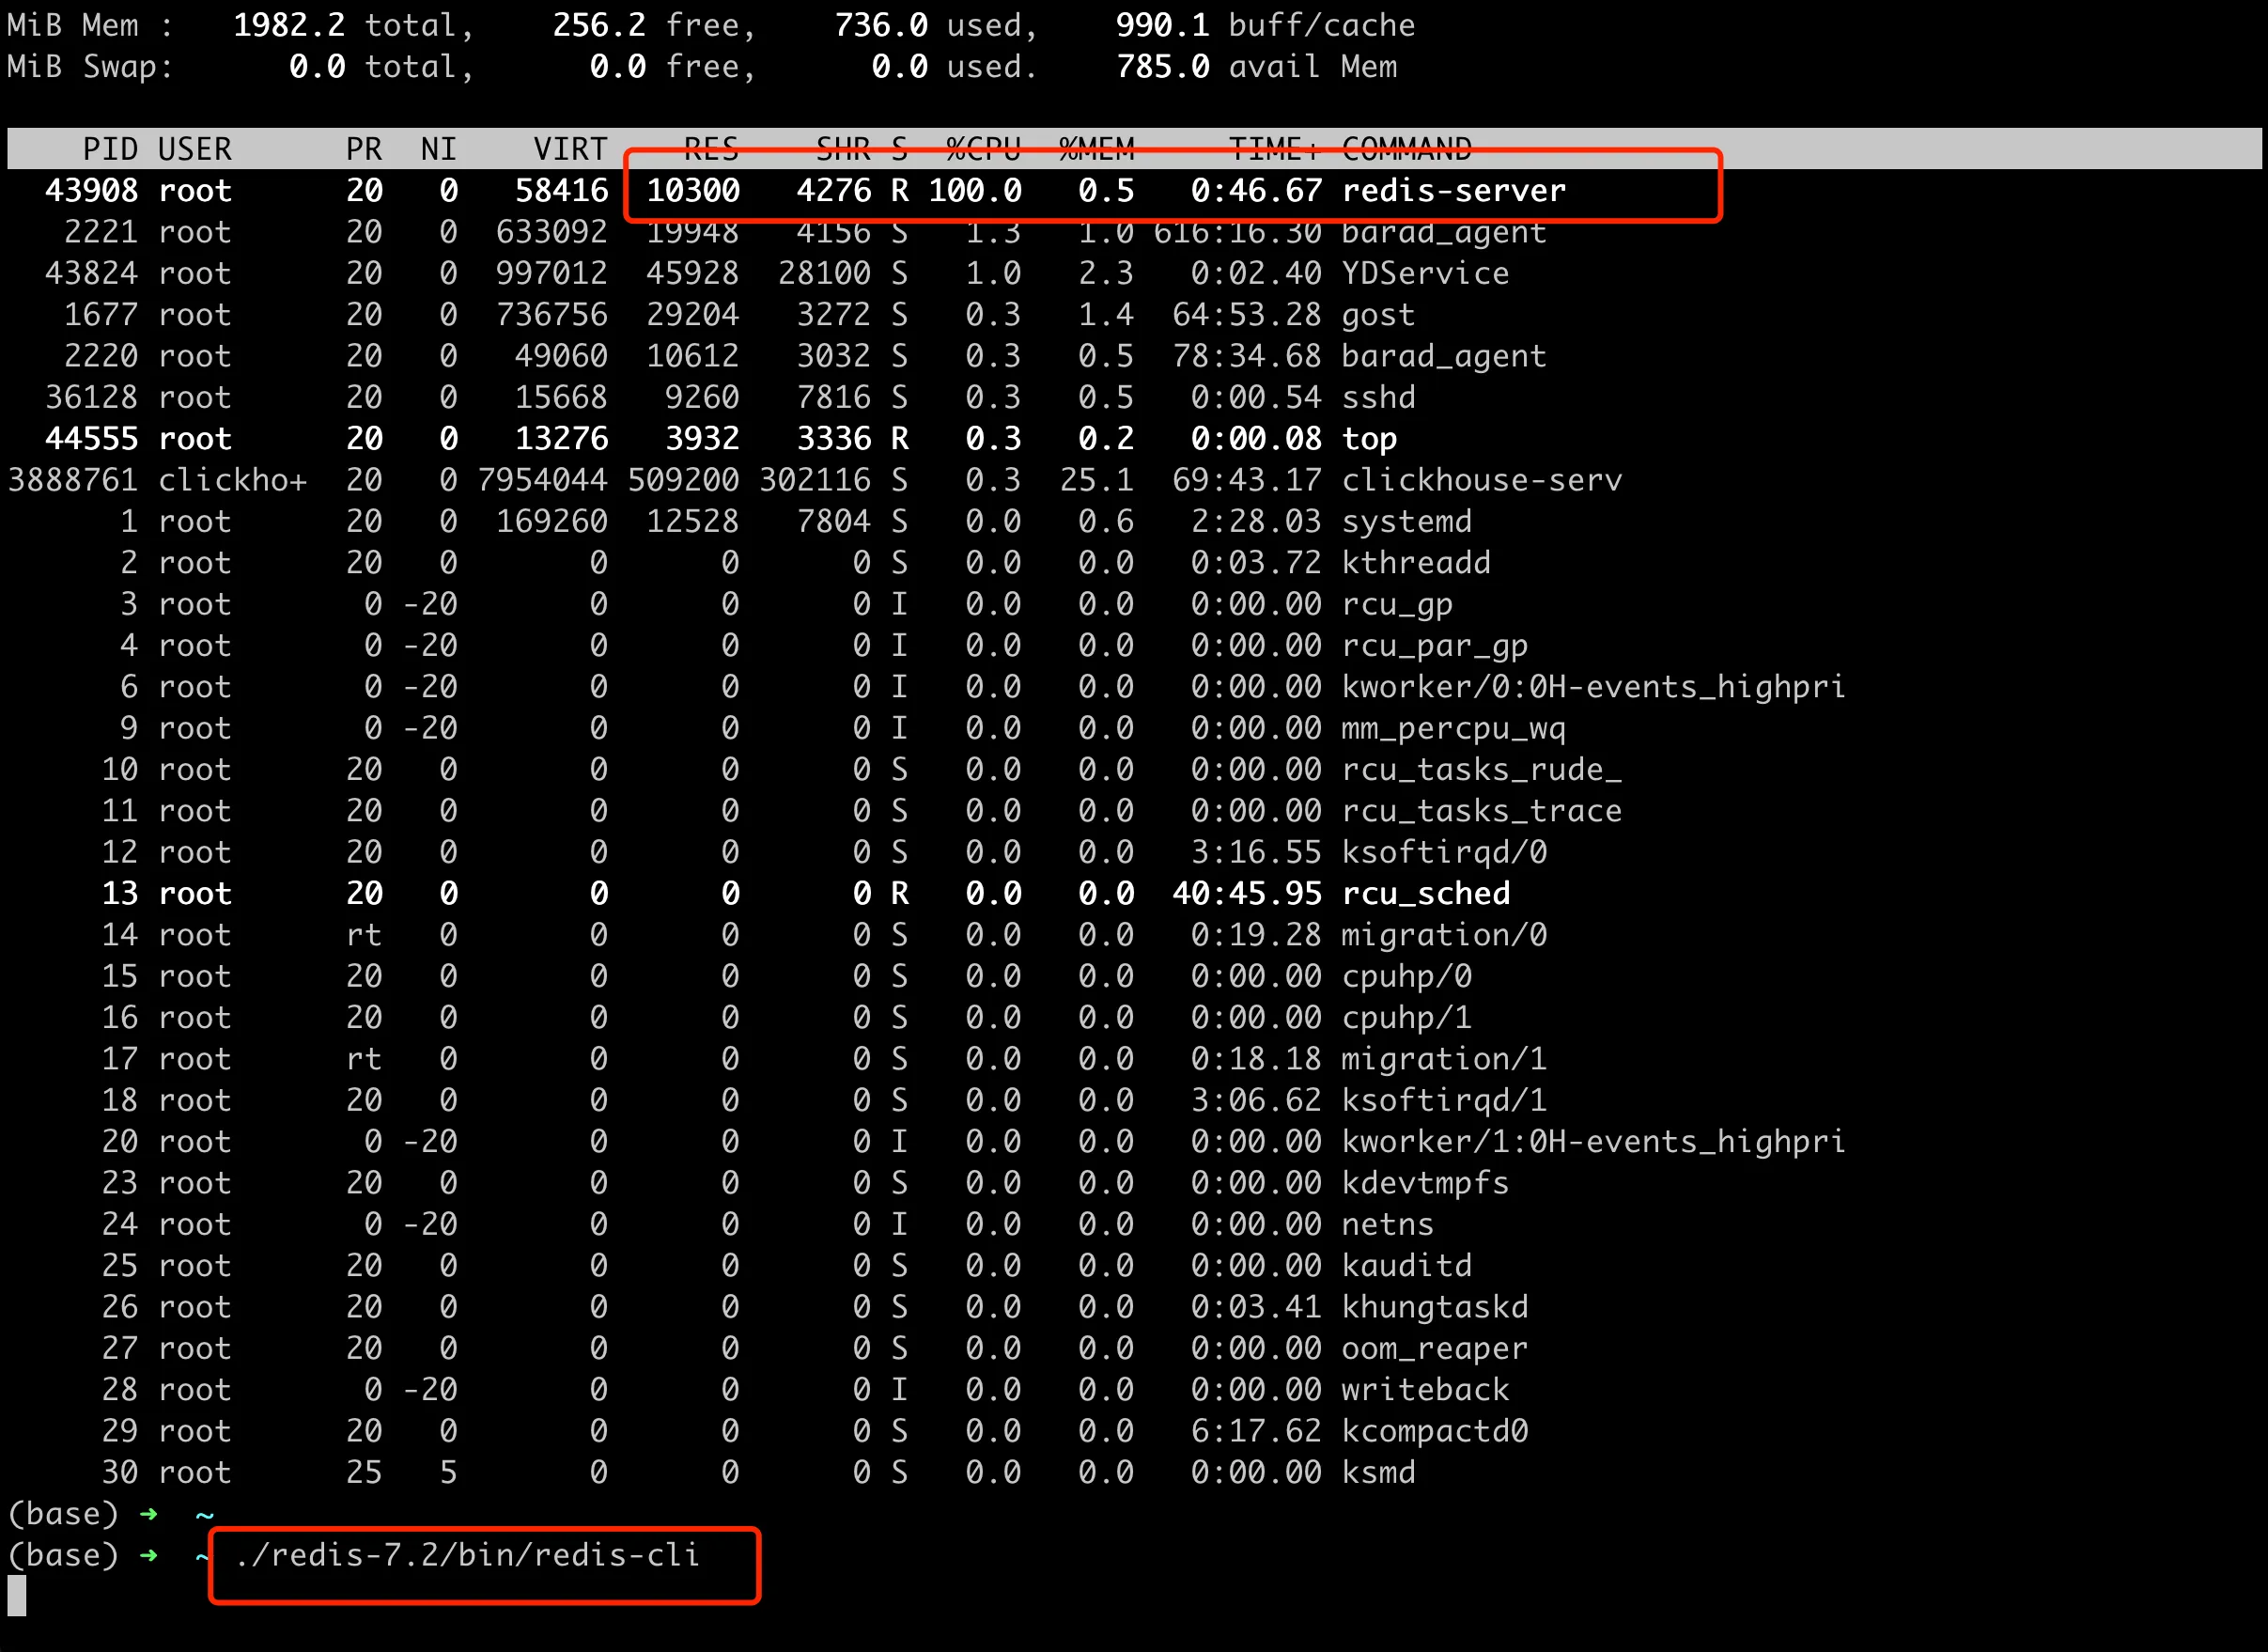
However, on version 7.2.0 (the source code is 7.2.0-rc2, and the compiled server version is v=7.1.241), things are not quite normal here. We directly download the source code of Redis 7.2 from Github Release 7.2-rc2, and then compile the binary. Here, we add these two flags to the compilation command make REDIS_CFLAGS="-Og -fno-omit-frame-pointer" to facilitate subsequent analysis tools to obtain stack information. The reproduction steps are simple: start the Redis server, then run these two scripts, feeder.py and subscriber.py. We will see that the subscriber gets blocked after processing some streams and stops outputting. At the same time, the CPU of the Redis process directly spikes to 100%, and new redis clients can’t connect to the server either, as shown in the following figure.


The problem persists even after killing the two scripts, unless the server is restarted.
ebpf Analysis
Let’s not look at the analysis of the cause of the problem on the Issue first, but directly use general methods to analyze the reason for high CPU usage here. For CPU analysis, the first choice is profile sampling, then converting it to a flame graph. Here, I strongly recommend brendangregg’s blog CPU Flame Graphs, which introduces how to use tools to analyze CPU usage for services in different languages. For Redis, the official documentation also provides guidance. Here we refer to the official Redis CPU profiling and use ebpf to generate CPU flame graphs.
How to install bcc-tools can be found in the official documentation, which we won’t expand on here. Then we can use the profile tool to do CPU sampling.
1 | profile -F 999 -f --pid $(pgrep redis-server) 60 > redis.folded.stacks |
profile is a tool in the BCC (BPF Compiler Collection) toolset used to collect CPU stack trace information. The parameters of this command mean:
- -F 999, sets the sampling frequency to 999 Hz, i.e., sampling 999 times per second. Choosing an odd number 999 for the sampling frequency is to avoid synchronization with other activities, which could lead to misleading results. If the sampling frequency synchronizes with certain periodic activities in the system (such as timer interrupts, context switches, etc., which generally have even cycles, like 100Hz), the sampling results might be biased towards these activities, leading to biases in the analysis results.
- -f folds stack trace information, making it more suitable for generating Flame Graphs.
- –pid $(pgrep redis-server), specifies the process ID to collect, here using pgrep redis-server to get the PID of the redis-server process.
- 60, the duration of collection in seconds. The profile command given in the official Redis documentation may not be applicable to some versions.
Then we use the flamegraph.pl script, which is a script in the FlameGraph toolset used to convert stack trace information into SVG format Flame Graphs. The final generated CPU flame graph is as follows. Here, a very small part of the unknown call stack has been manually filtered out (otherwise the image would be too long and affect readability a bit).
Through the flame graph, we have found the execution stack where the CPU is running at full capacity. In the next article, we will continue to analyze why the code here is being executed continuously.

