Stack Preservation in Complex C++ Projects and eBPF Performance Analysis
When building and maintaining complex C++ projects, performance optimization and memory management are crucial. When faced with performance bottlenecks or memory leaks, we can use eBPF (Extended Berkeley Packet Filter) and BCC (BPF Compiler Collection) tools for analysis. As we saw in Redis Issue Analysis: “Deadlock” Problem Caused by Stream Data Read and Write (1), we used BCC’s profile tool to analyze Redis’s CPU usage, drew a CPU flame graph, and then could easily find the functions with high time consumption and their call chains.

A major prerequisite for using profile for analysis is that the binary file of the service must retain the stack information of functions. Stack information is a record of function calls and local variables during program execution. By looking at the stack information when the program executes to a certain point, we can know which functions have been called and how they are interrelated. This is crucial for debugging and optimizing code, especially when dealing with performance issues and memory leaks.
However, in actual projects, when we use eBPF to analyze service performance bottlenecks or memory leaks, we often cannot get the function call stack and encounter various unknown function call chains. This is because production environments usually do not include debugging information to reduce the size of binary files. Moreover, even if debugging information is generated with -g when compiling C++ code in the production environment, we may not be able to get a complete function call stack. The reasons for this are complex, and this article will expand on this issue.
Program Stack Information
In computer science, a stack is a basic data structure that follows the Last-In-First-Out (LIFO) principle. This means that the last element added to the stack is the first to be removed. Stacks have many uses in program design, with the most common being their application in function calls and local variable storage.
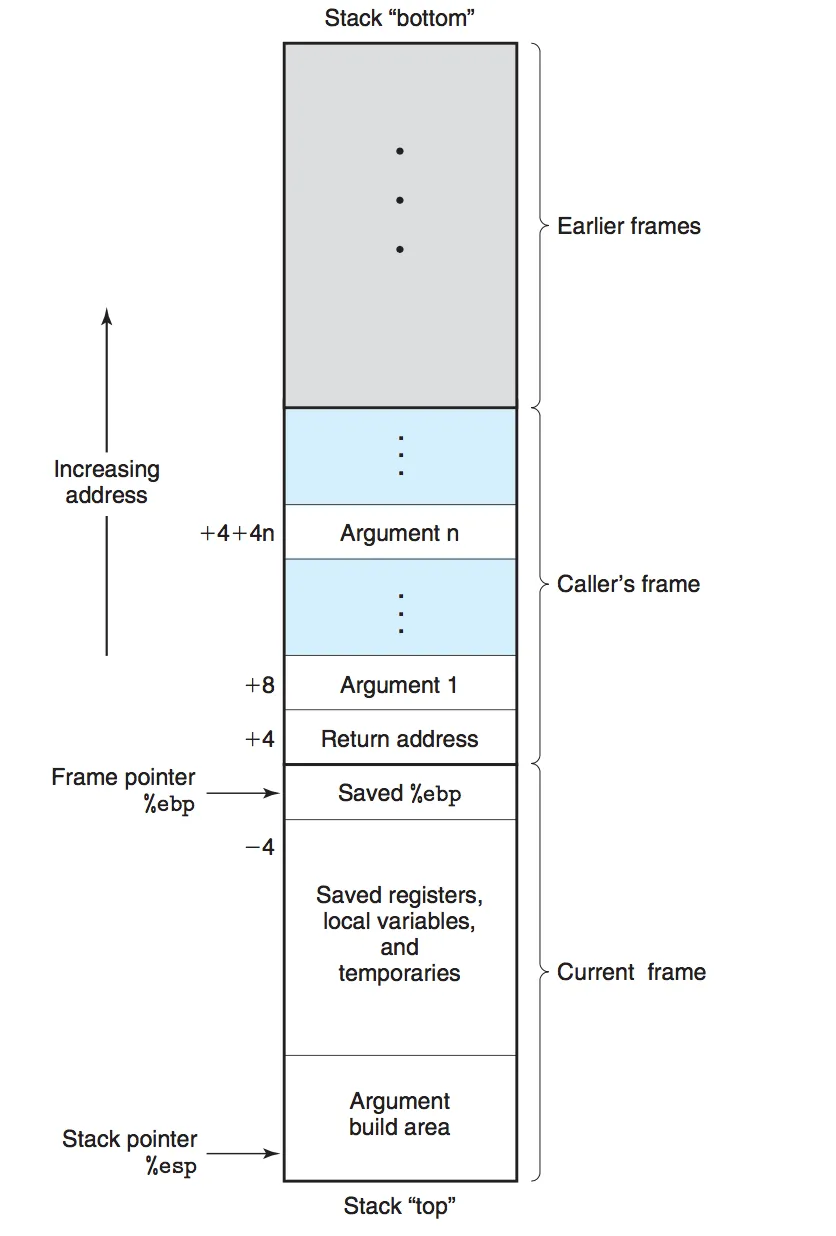
During program execution, the stack is used to manage function calls, which is called the "call stack" or "execution stack". When a function is called, a new stack frame is created and pushed onto the call stack. This stack frame includes:
- Return address: The memory address where the program should continue executing after the function completes.
- Function parameters: The arguments passed to the function.
- Local variables: Variables defined within the function.
- Frame pointer: A pointer to the previous stack frame, to restore the context of the previous stack frame when the current function returns.
When a function completes execution, its stack frame is popped off, and control returns to the saved return address. The distribution of the stack in memory is shown in the following figure:
Stack Information in DWARF Format
Function call stack information is saved in binary files in DWARF format. DWARF is a standard format for representing debugging information for programs, widely used in Unix and Linux systems. It is a very flexible and extensible format that can represent rich debugging information, including but not limited to source code line numbers, variable names, data types, stack frames, and their relationships.
DWARF consists of a series of “debug sections”, each containing specific types of debugging information. For example, .debug_info: contains information about program structure, such as variables, types, and procedures. .debug_line: contains mappings of source code line numbers and addresses, which is very useful for locating source code positions in debuggers. You can see the specific format standards on the DWARF official website, such as the current Version 5, which has a PDF recording detailed specifications.
The article How debuggers work: Part 3 - Debugging information uses actual code, combined with objdump and readelf tools, to delve into the DWARF debugging information format, which is worth reading.
For C++ projects, to generate binary files containing DWARF debugging information during compilation, compiler compilation options need to be used. For GCC and Clang compilers, this is usually done using the -g flag. Here’s a simple example code:
1 | // dwarf.cpp |
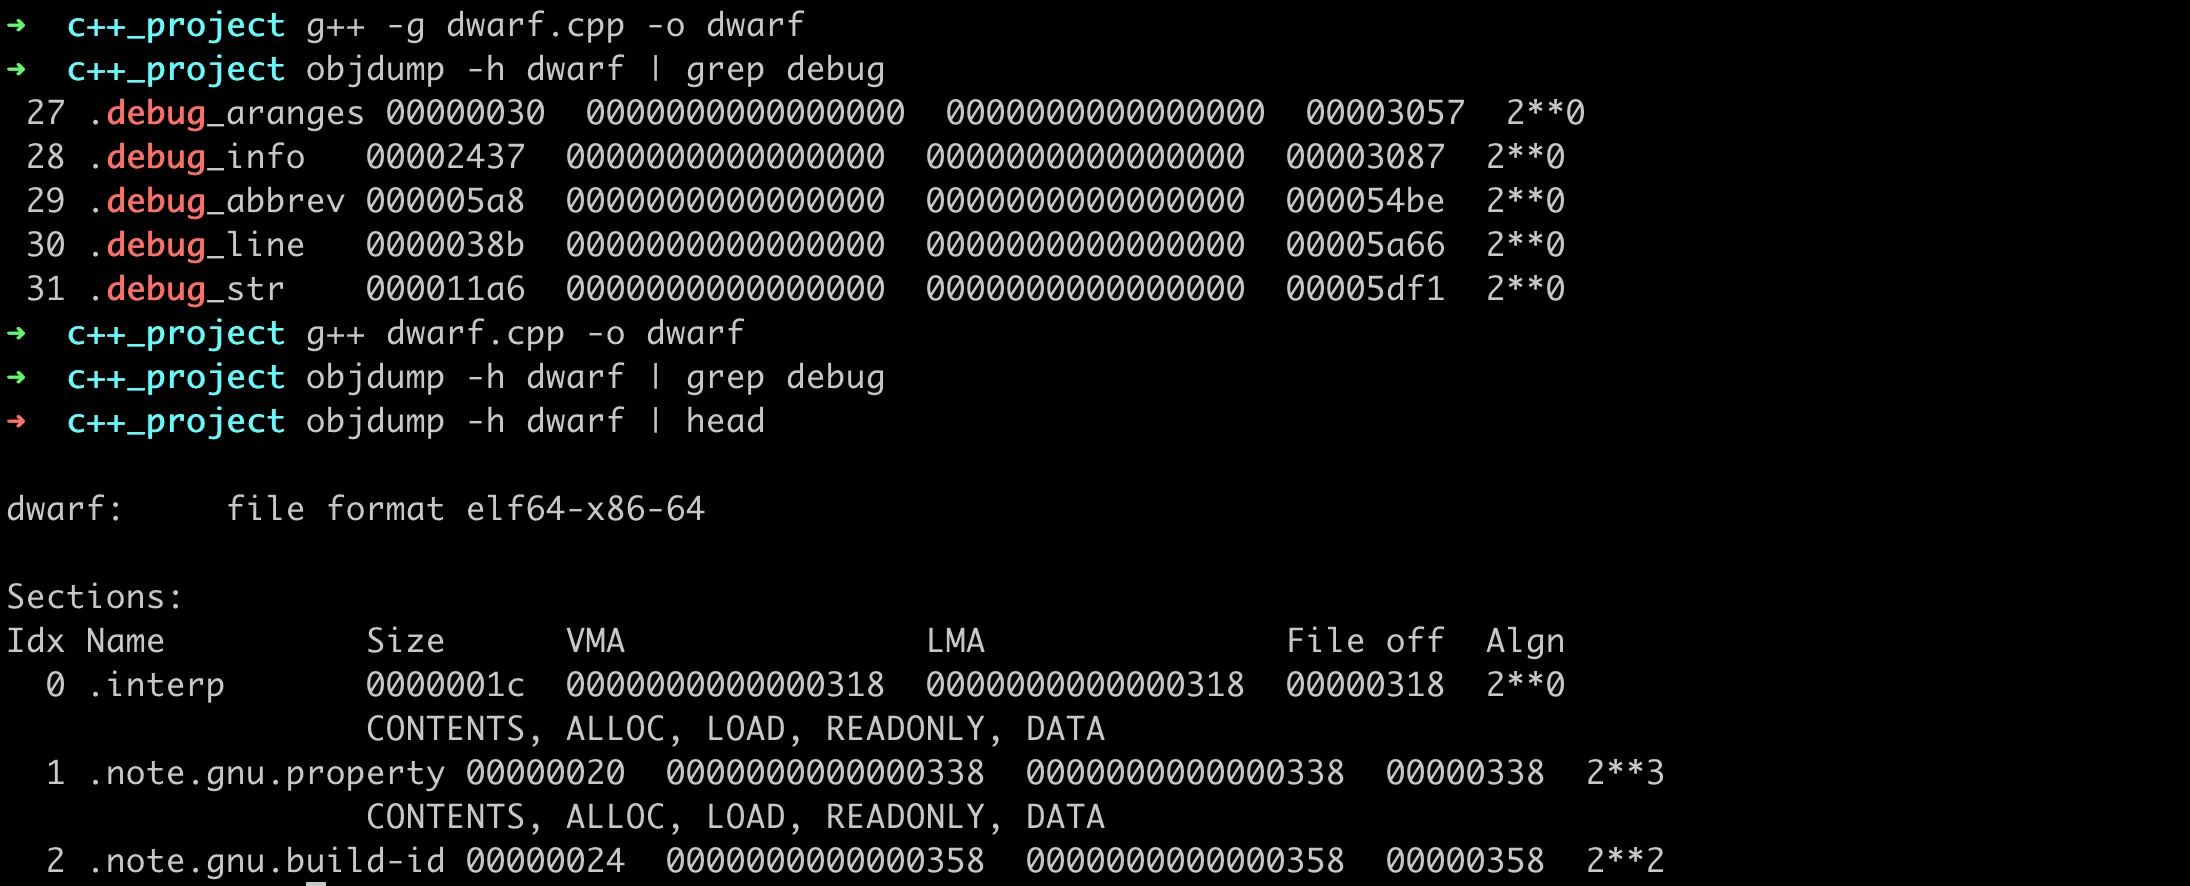
In the generated ELF binary file, we can use objdump’s [-h|--section-headers|--headers] option to print all section headers. If compiled with -g, the generated file contains DWARF debugging information, mainly with sections like debug_aranges, .debug_info, etc. Without the -g option, the generated binary file does not have these sections.
If the binary ELF file carries DWARF information, when debugging with GDB, you can set function line breakpoints, step through code, check variable values, and view function call stacks, etc. In addition, traditional performance analysis tools like perf can also read DWARF information to parse function call stacks, as shown in the following command:
1 | perf record --call-graph dwarf ./my_program |
Parsing Stack with Frame Pointer
Although DWARF information is very useful for debugging, eBPF-based tools cannot read stack information from DWARF. In eBPF, another method is used to read stack information, which is the frame pointer. Frame pointers can provide us with complete stack traces. Frame pointers are perf’s default stack traversal and currently the only stack traversal technology supported by bcc-tools or bpftrace.
To retain frame pointers in the generated binary file, ensure that frame pointers are enabled when compiling the program. This can be done using compiler flags, such as -fno-omit-frame-pointer in GCC. Here’s a simple example code:
1 | // fp_demo_write.cpp |
After compiling with -fno-omit-frame-pointer, we can use profile to get the function call stack of CPU time consumption, and then use FlameGraph to get the CPU flame graph.
1 | g++ fp_demo_write.cpp -fno-omit-frame-pointer -o fp_demo_write |
Here’s the CPU flame graph, which shows the overall function call chain and the time consumption of various operations:

In the example function above, we used write(STDOUT_FILENO, message, 16); to print strings. Initially, we used C++’s std::cout to print, but the CPU flame graph was a bit different from expected. We can see that at the same level as __libc_start_call_main, there’s an unknown function frame, and within it are the write and std::basic_ostream<char, std::char_traits<char> >::~basic_ostream() functions.

Theoretically, all functions here should be in the function stack of main, but now there’s a parallel unknown call stack. This might be related to the internal workings and buffering mechanism of the C++ standard library glibc. When using std::cout to write data, the data is not immediately written to standard output, but stored in an internal buffer until the buffer is full or explicitly flushed. The output here is controlled by glibc, so the call stack is not in main.
If you want to verify whether our binary file has frame pointer information, we can use objdump to get the disassembled content, and then check if the starting instruction of the function is push %rbp; mov %rsp,%rbp. For the previous example, we can see the disassembled result as follows:
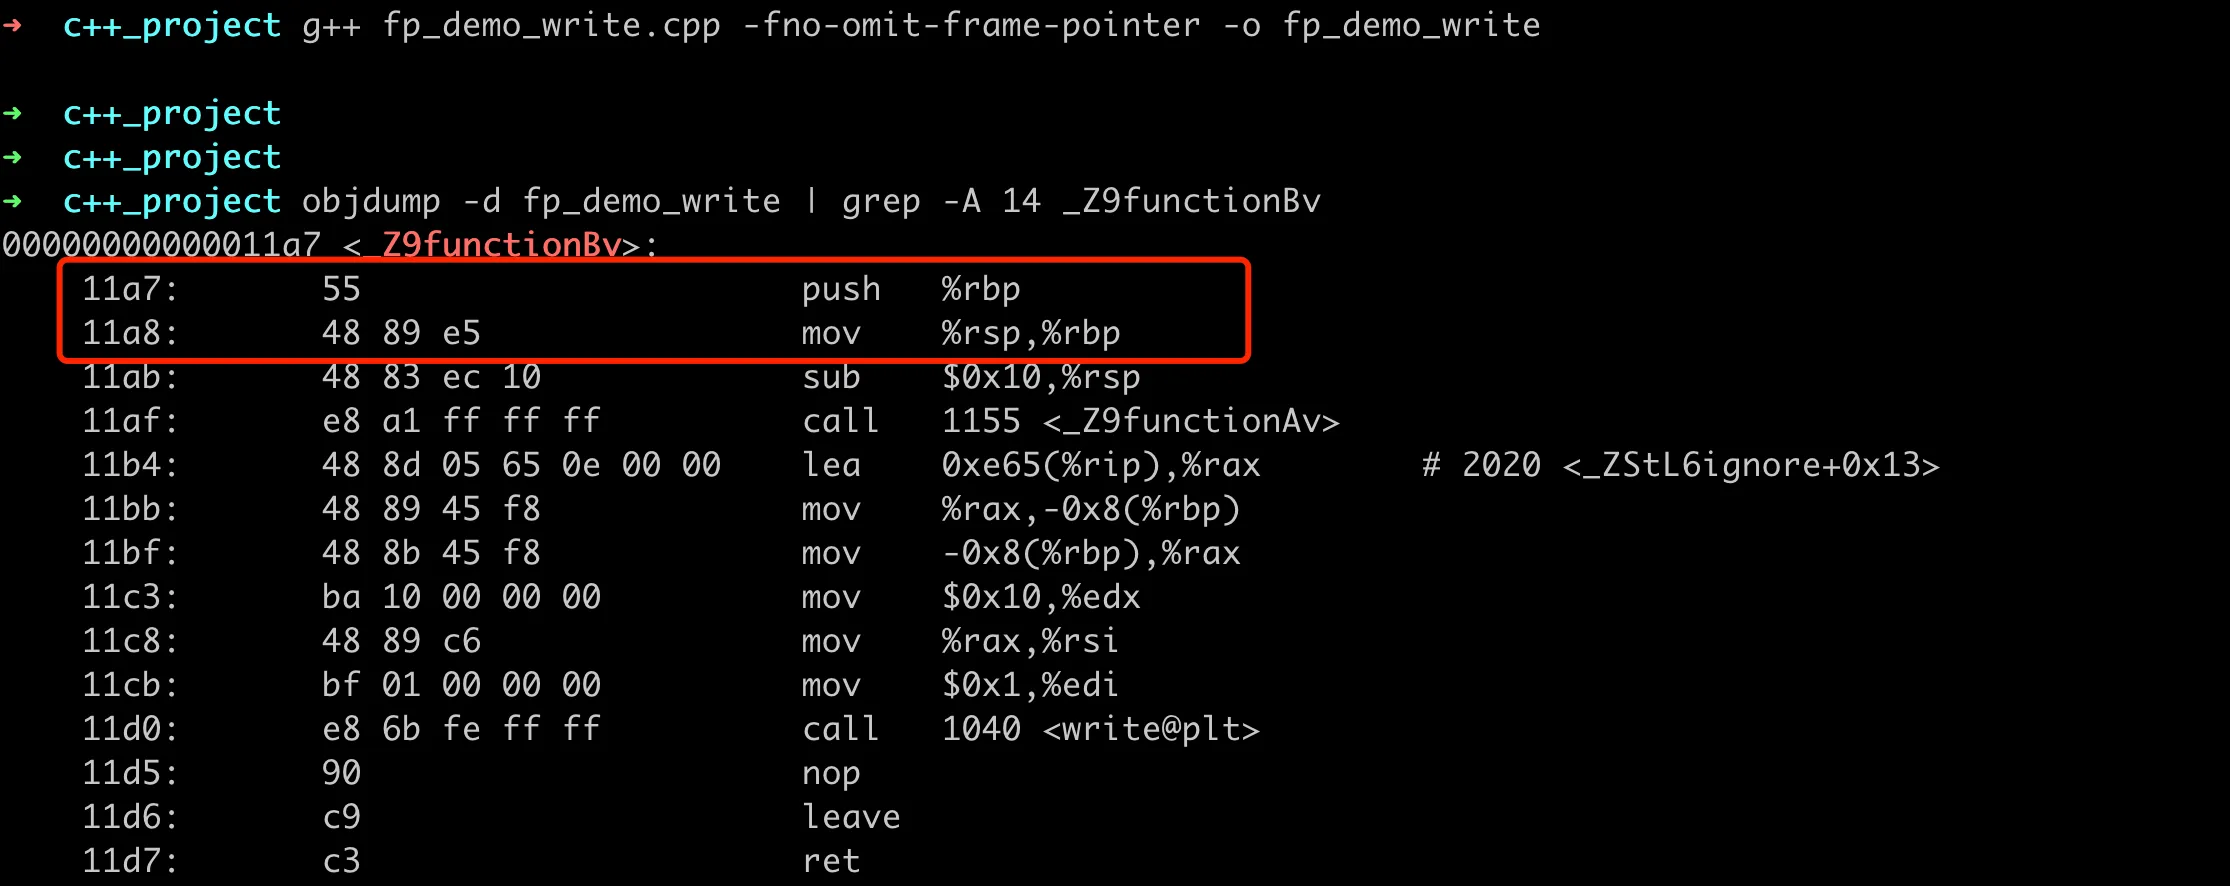
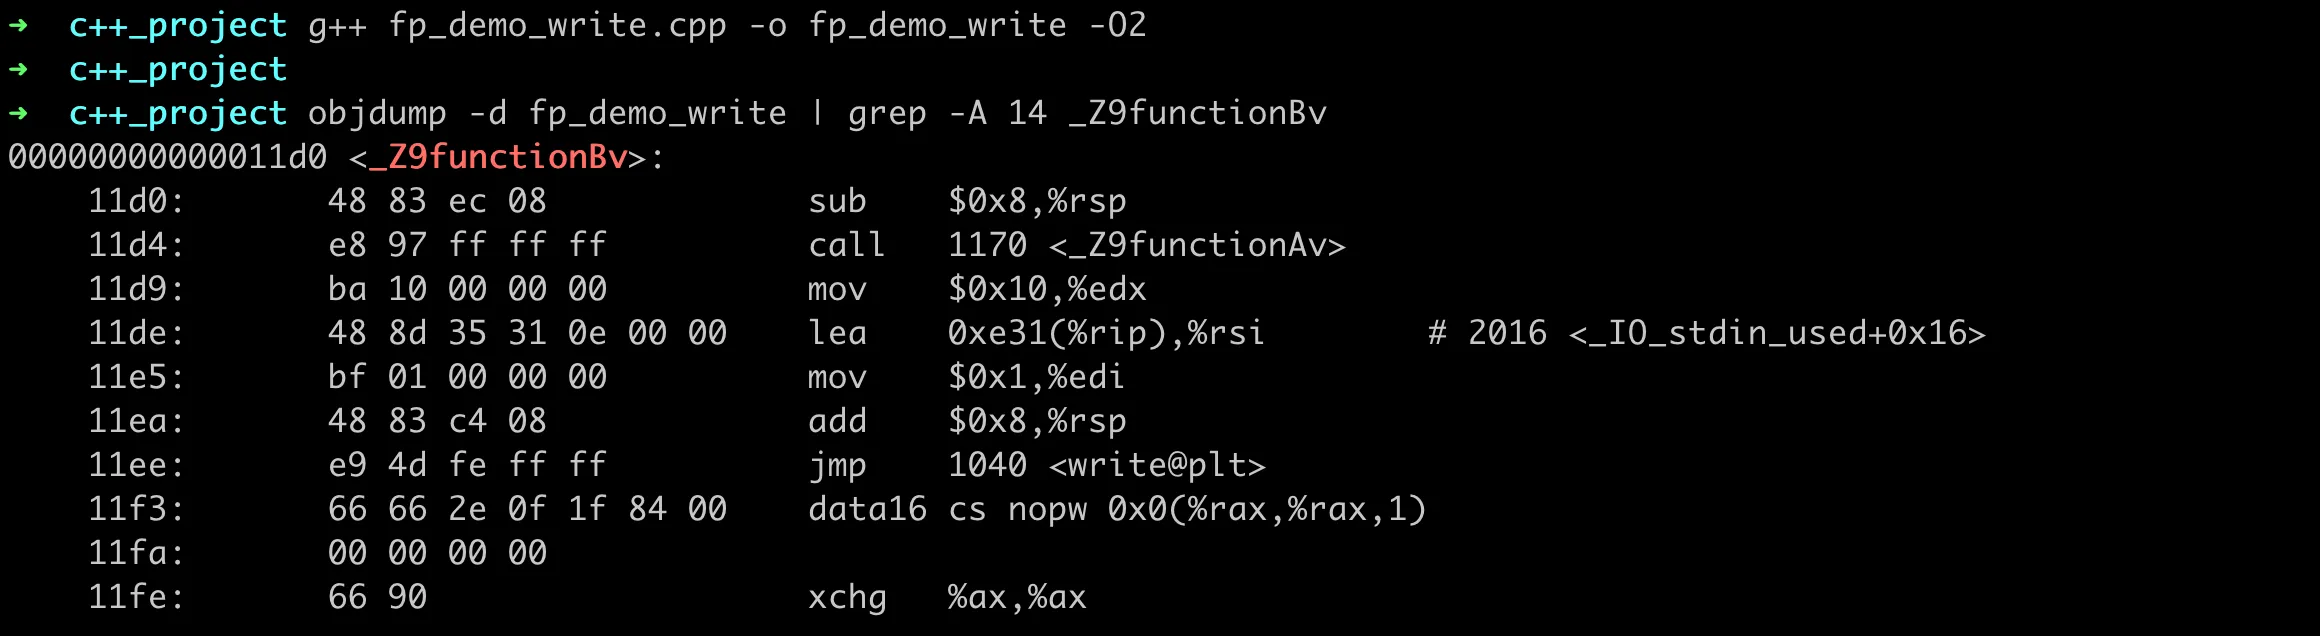
In the GCC/G++ compiler, whether the -fno-omit-frame-pointer option is used by default depends on the version of the compiler and the target architecture. On some versions and/or architectures, frame pointers may be retained by default. If frame pointers are not retained, the generated binary assembly code will not have the relevant rbp parts. On my machine, the default compilation also has frame pointers. After enabling compilation optimization with -O2, the generated binary does not have frame pointers, as shown below:
If we use profile to analyze again, we won’t be able to get complete function call stack information, as shown in the following figure:

In actual project development, it is recommended to add -fno-omit-frame-pointer to the default compilation options to facilitate subsequent analysis. On the wiki of the Linux distribution Fedora, you can see that someone has proposed to enable Changes/fno-omit-frame-pointer by default, listing the benefits of doing so and the possible performance losses.
Compilation of Complex C++ Projects
In the examples above, we’re compiling a simple cpp file. For actual projects, there might be many cpp files and various complex third-party library dependencies. How to ensure that the finally compiled binary file retains complete stack information becomes challenging. Next, we’ll focus on how the compilation option -fno-omit-frame-pointer affects the final generated binary file for projects with complex third-party dependencies.
Dynamic Linking and Static Linking
C++ projects have two ways of linking third-party libraries: static linking and dynamic linking. Static linking merges the code of all library files into a single executable file at compile time, meaning the executable file contains all the code it needs and doesn’t depend on external library files. Unlike static linking, dynamic linking doesn’t merge library code into the executable file. Instead, it dynamically loads libraries at runtime, meaning the executable file only contains references to libraries, not the actual library code.
Here are some characteristics of static linking and dynamic linking:
| Characteristic | Static Linking | Dynamic Linking |
|---|---|---|
| Deployment difficulty | Simple, only one file needs to be distributed | More complex, need to ensure the executable can find dependent libraries |
| Startup time | Usually faster, as there’s no additional loading overhead | May be slower, as libraries need to be loaded at runtime |
| File size | Usually larger, as it includes code for all dependencies | Usually smaller, as it only includes references to libraries |
| Memory usage | Usually higher, each instance has its own copy of the library | Usually lower, multiple instances can share the same library memory |
| Compatibility | Can better control versions, as libraries are embedded and not affected by external library updates | May face compatibility issues if external libraries update and are not backward compatible |
For a large C++ project, the specific choice of linking method may depend on the team’s trade-offs. Overall, all possible dependency relationships between project modules can be categorized into several situations as shown in the following figure:

The image is rendered by Graphviz, with the image source code as follows:
1 | digraph G { |
Among these, the most common dependency methods are static libraries depending on other static libraries, and dynamic libraries depending on other dynamic libraries. The following analysis will be based on these two dependency relationships. It is feasible for dynamic library A to depend on static library B, and in some cases, it makes sense. For example, if static library B contains some code that doesn’t change frequently, while dynamic library A contains some code that is frequently updated. It is not recommended to depend on dynamic library A in static library B, because static libraries are usually viewed as independent code blocks that do not depend on external dynamic linking.
Stack in Static Linking
Next, we’ll analyze what impact it will have in the case of static linking if some intermediate third-party dependencies are not compiled with the -fno-omit-frame-pointer option.
Suppose a main.cpp depends on utils.cpp and static library static_A, static library static_A depends on static library static_B, and static_A is compiled without -fno-omit-frame-pointer, but all others are compiled with -fno-omit-frame-pointer. In the final generated binary file, will the functions in each static library and cpp file have frame pointers? In this case, can eBPF and BCC tools parse out stack information to the maximum extent?
We create a complete example project locally, including all the dependency relationships mentioned above. The code structure is as follows, with the complete code available on Gist:
1 | FP_static_demo tree |
Then in the compiled binary file, we find that the functions in static_A don’t have frame pointers, but static_B and other functions do have frame pointers. After running the binary, we use the eBPF profile command to analyze the CPU time stack, with the following command:
1 | profile -F 999 -U -f --pid $(pgrep main) 60 > depend_main.stack |
In the generated CPU flame graph, the function call stack obtained is jumbled, as shown in the following figure:

Normally, if no frame pointers are lost, the flame graph should look like this:

Through the above experiment, we can see that the profile tool relies on frame pointers to reconstruct the call stack when analyzing performance. Even if only the frame pointers of some intermediate dependent libraries are lost, the overall function call stack becomes jumbled, not just losing the function call stack of this intermediate part.
Still in the above scenario, if we don’t save stack information when compiling the bottom-most static_B, but all other parts do save it, then in the generated binary file, only the functions in static_B don’t have frame pointers. Using profile to analyze the CPU stack again, we find that although only the last layer of function calls doesn’t have frame pointers, the stack information obtained by BCC tools is still problematic, as shown in the following figure, where printStaticA and function_entry are mixed at the same level. Running multiple times here might result in different stack information graphs, but they are all incorrect.

Stack in Dynamic Linking
In the case of dynamic linking, if some intermediate third-party dependencies are not compiled with the -fno-omit-frame-pointer option, theoretically, it should be the same as static linking, where stack information becomes jumbled. However, let’s write an example to verify this. We’ll use the same main.cpp and function call relationships as above, changing all static dependencies to dynamic dependencies. The revised directory structure is as follows:
1 | tree |
The complete code is still available on Gist. The normal stack looks like this:

Modify the Makefile to ignore the stack only when compiling dynamic_A, and the resulting CPU flame graph is as follows:

Modify the Makefile to ignore the stack only when compiling dynamic_B, and the resulting CPU flame graph is as follows:

Consistent with our earlier guess, once some stack information is lost, the analyzed stack graph becomes jumbled.
Reference Articles
Practical Linux tracing ( Part 1/5) : symbols, debug symbols and stack unwinding
How debuggers work: Part 3 - Debugging information
Understanding how function call works
Hacking With GDB

