In-depth Understanding of eBPF-based C/C++ Memory Leak Analysis
For C/C++ programmers, memory leak is a perennial issue. There are many methods to troubleshoot memory leaks, such as using tools like valgrind, gdb, asan, tsan, etc., but each of these tools has its limitations. For example, valgrind slows down program execution, gdb requires understanding of the code and manual breakpoint setting, while asan and tsan require recompiling the program. For complex services that are already running, these methods are not very convenient.
Fortunately, with eBPF, we can analyze memory leak problems without recompiling the program and with minimal impact on program execution speed. The power of eBPF is evident, but eBPF is not a silver bullet. There are still many issues to be resolved when using it to analyze memory leaks. This article will discuss the common problems encountered in eBPF-based detection.
Memory Leak Simulation
In C/C++, a memory leak refers to a situation where the program, for some reason, fails to release memory that is no longer in use during its execution, resulting in a waste of system memory. Once a memory leak occurs, it can cause the program to run slower or even be killed by OOM (Out of Memory). Memory leaks often occur due to not releasing memory in a timely manner when writing programs, or due to design flaws that prevent the program from releasing memory that is no longer in use during execution.
Below is a simple memory leak simulation program. The program allocates memory in a loop but doesn’t release it, leading to a memory leak. The main program is as follows, with the leaking function call chain being main->caller->slowMemoryLeak:
1 |
|
The memory-leaking code is in the slowMemoryLeak function, specifically as follows:
1 | namespace LeakLib { |
Note that during compilation, the frame pointer option is included (controlled by the -fno-omit-frame-pointer option). This is because eBPF tools need to use the frame pointer for call stack tracing. If we ignore the frame pointer here (-fomit-frame-pointer), eBPF-based tools won’t be able to get the stack information of the memory leak. The complete compilation command is as follows (-g can be omitted, but it’s added here to facilitate viewing some information with gdb):
1 | g++ main.cpp leak_lib.cpp -o main -fno-omit-frame-pointer -g |
memleak Analysis
Next, let’s perform memory leak analysis based on eBPF. BCC comes with a memleak memory analysis tool that can be used to analyze the call stack of memory leaks. For the example leak code above, after compilation and execution of the program, run the memory leak detection memleak -p $(pgrep main) --combined-only.
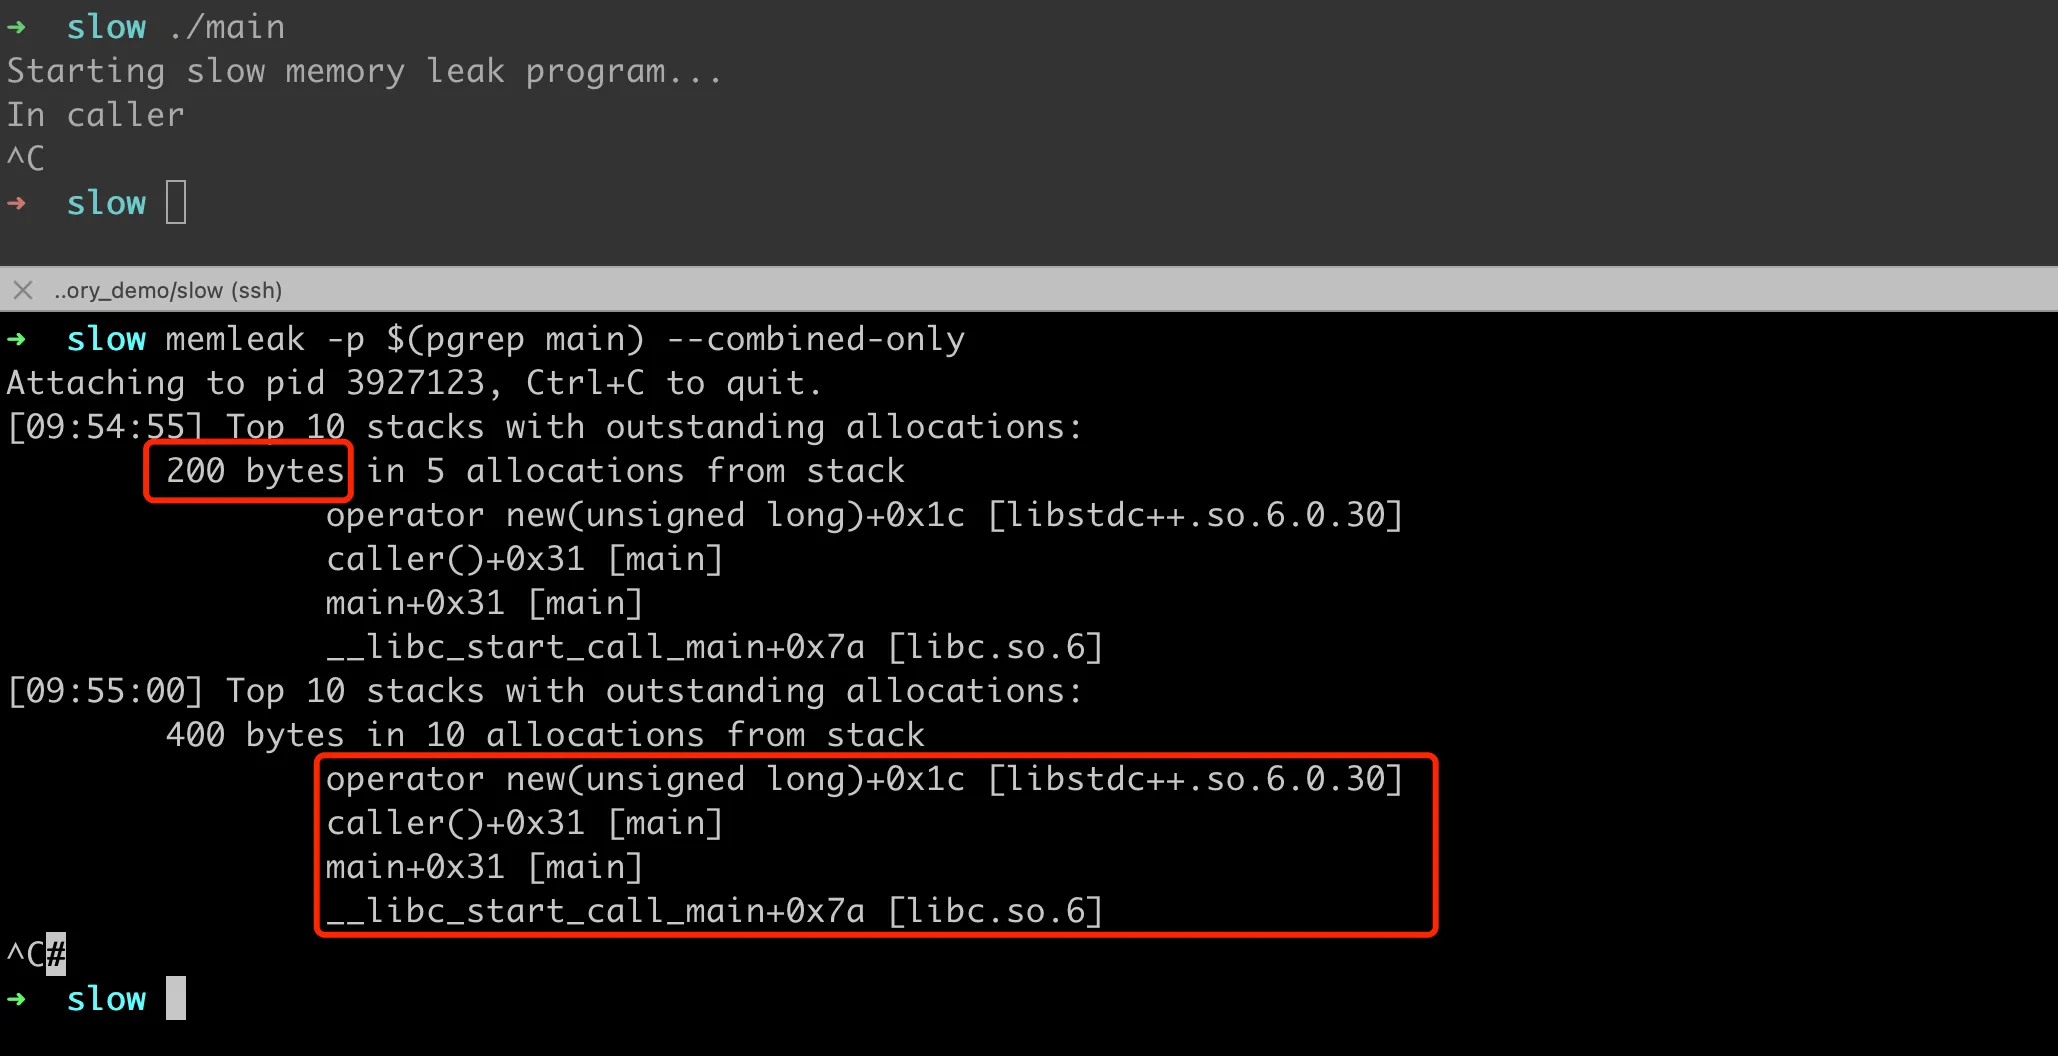
The current version of the memleak tool has a bug that causes an error when printing with --combined-only. The fix is simple, and I’ve submitted PR #4769, which has been merged into master. Looking closely at the script’s output, we can see that the call stack here is actually incomplete, missing the slowMemoryLeak function call.
1 | [11:19:44] Top 10 stacks with outstanding allocations: |
Incomplete Call Chain
Why is the intermediate function call lost here? We know that eBPF-related tools use the frame pointer to trace the call stack. For the specific principle, you can refer to my friend’s article The Disappearing Call Stack Frame - Principle Analysis of FP-based Stack Tracing. If you encounter an incomplete call chain, it’s usually due to a missing frame pointer. Let’s verify this.
First, use objdump -d -S main > main_with_source.asm to generate assembly instructions with source code. Find the assembly code for the slowMemoryLeak function, as shown in the following image:
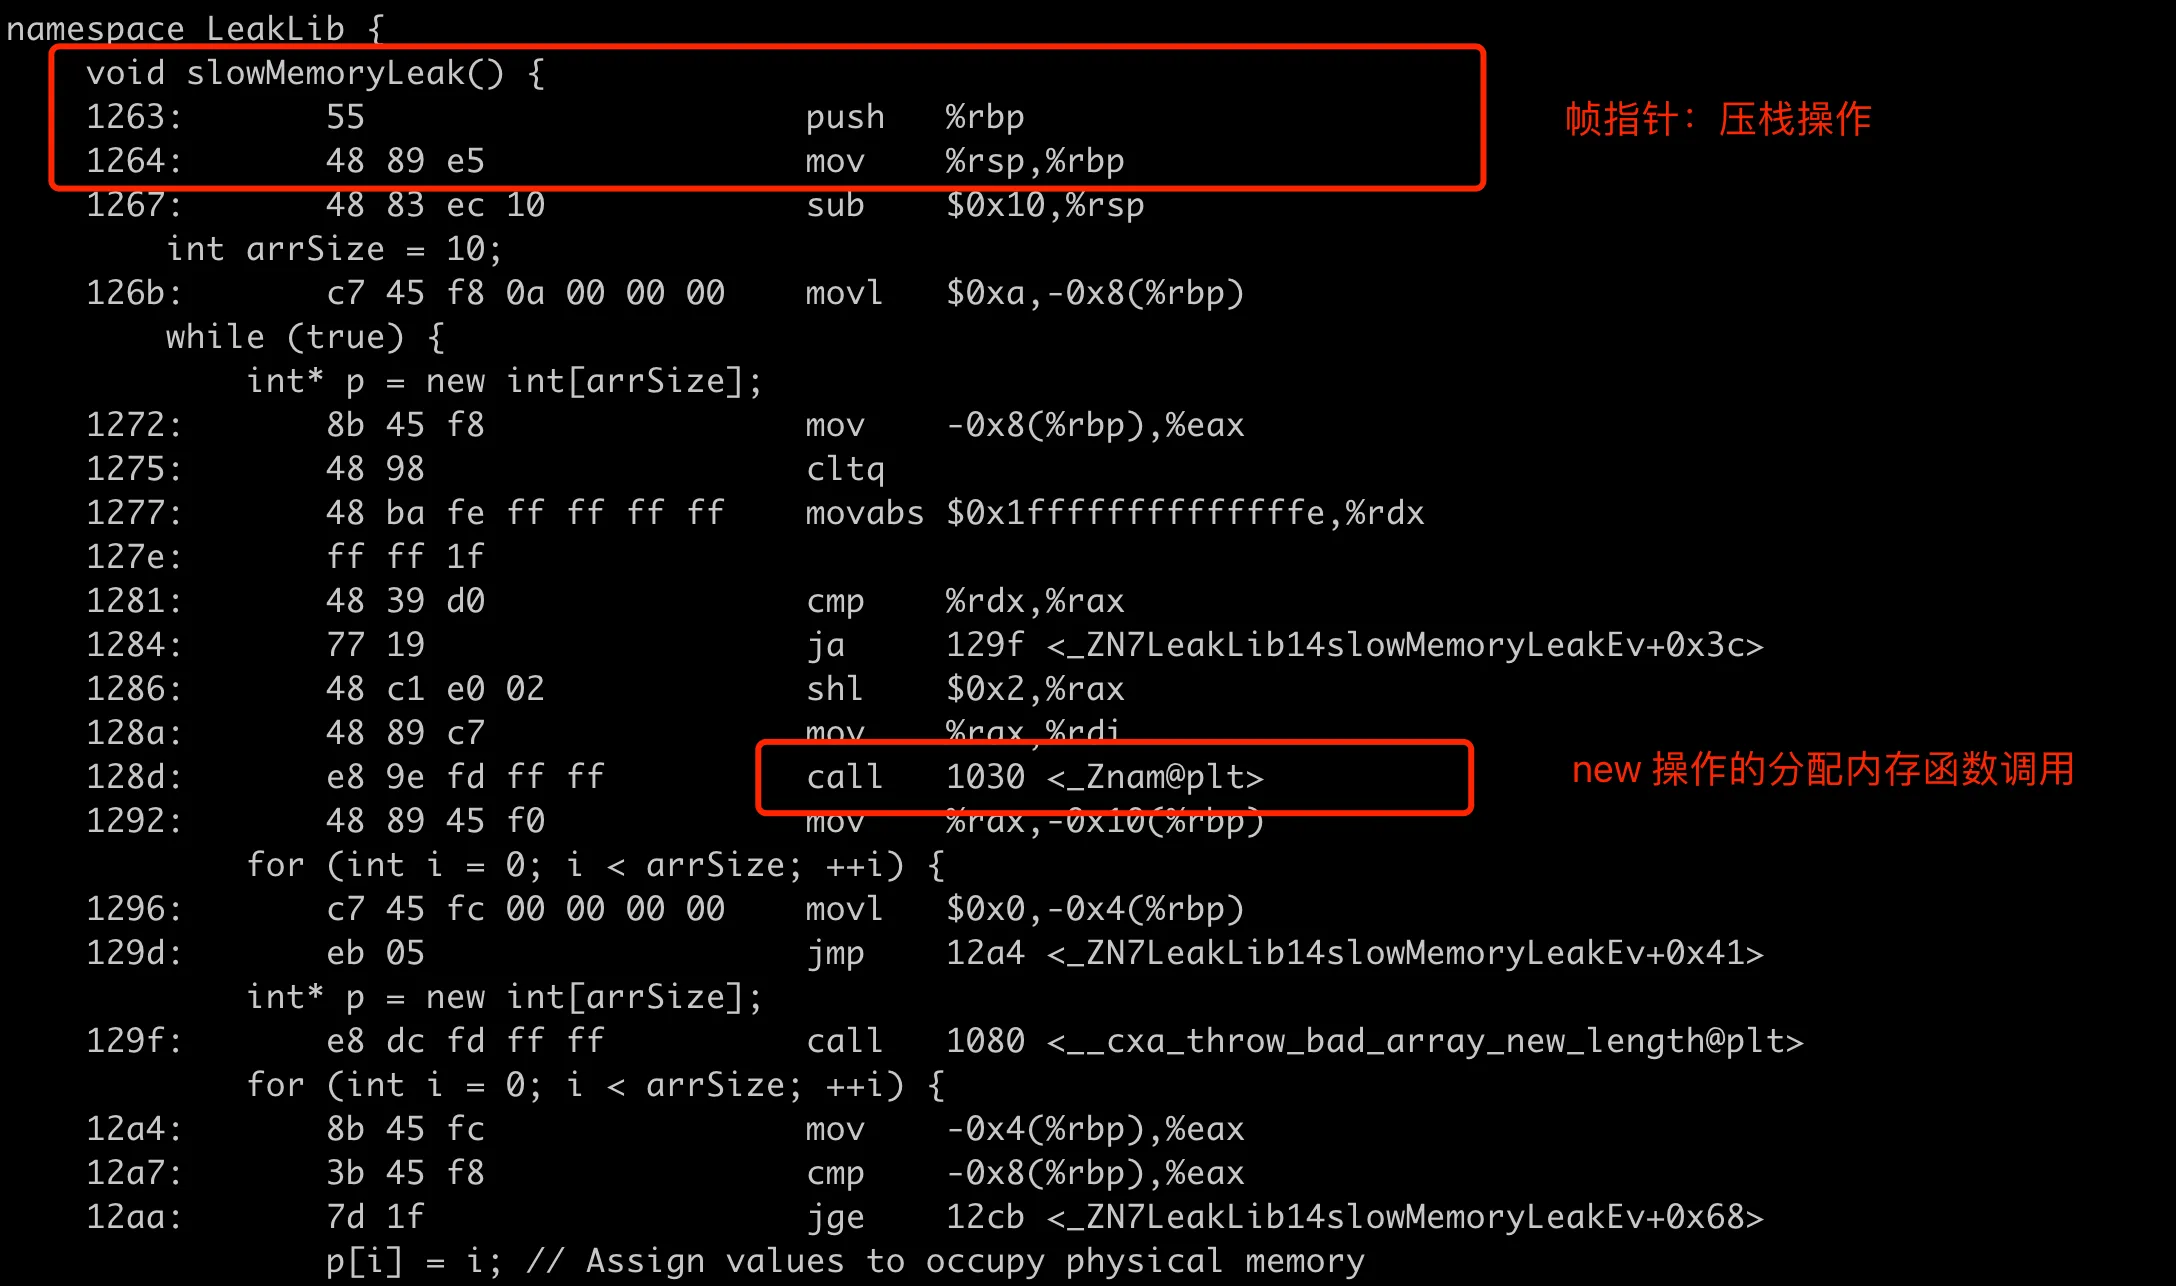
From this assembly code, we can see that new int[] corresponds to a call to _Znam@plt. This is the name-mangled form of C++’s operator new[], as follows:
1 | c++filt _Znam |
We know that in C++, the new operation is used for dynamic memory allocation and usually ends up calling underlying memory allocation functions like malloc. Here, _Znam@plt is done through the PLT (Procedure Linkage Table), which is a dynamically resolved symbol, typically implemented as operator new[] in libstdc++ (or other C++ standard library implementations). The assembly code corresponding to _Znam@plt is as follows:
1 | 0000000000001030 <_Znam@plt>: |
There’s no push %rbp operation here like in the slowMemoryLeak call, so stack information will be lost. Why isn’t the frame pointer retained here? The -fno-omit-frame-pointer we used during compilation ensures that our own code includes frame pointers, but we have no control over the standard libraries we depend on, like libstdc++. The C++ standard library on the current system wasn’t compiled with frame pointers, possibly to reduce the overhead of function calls (by reducing the number of instructions executed). Whether to include -fno-omit-frame-pointer by default during compilation is quite controversial. There’s a dedicated section: Enabling Frame Pointers by Default at the end of the article to discuss this.
tcmalloc Leak Analysis
If you want to get the complete memory leak function call chain, you can recompile libstdc++ with frame pointers, although recompiling the standard library is quite troublesome. In fact, tcmalloc is more commonly used in daily work, with more efficient memory allocation management. To verify the performance of the above code under tcmalloc, I compiled the tcmalloc library with the -fno-omit-frame-pointer frame pointer. As follows:
1 | git clone https://github.com/gperftools/gperftools.git |
Then run the above binary and use memleak to check for memory leaks again. Note that -O is used here to pass the path of the libtcmalloc.so dynamic library to memleak. The parameter value is stored in obj and used in attach_uprobe to specify the binary object to attach uprobes or uretprobes to, which can be the library path or executable file of the function to be traced. For detailed documentation, refer to bcc: 4. attach_uprobe. For example, the following call method:
1 | # Set a breakpoint at the entry of the getaddrinfo function in libc. When entering the function, it will call the custom do_entry function |
Note that in the previous example, -O was not specified, so the default was “c”, which means using libc for memory allocation. When using the tcmalloc dynamic library, attach_uprobe and attach_uretprobe must specify the library path:
1 | bpf.attach_uprobe(name=obj, sym=sym, fn_name=fn_prefix + "_enter", pid=pid) |
However, the tool’s output is a bit surprising, as it doesn’t output any leaking stack:
1 | memleak -p $(pgrep main) --combined-only -O /usr/local/lib/libtcmalloc.so |
The memory allocated by new is clearly not being released, so why can’t the eBPF tool detect it?
Deep Dive into Tool Implementation
Before guessing the reason, let’s take a closer look at the code of the memleak tool and fully understand the tool’s implementation principle. First, we can be clear that the final output of the tool is each call stack and its leaked memory amount. To get this result, eBPF sets breakpoints at both memory allocation and deallocation, records the memory allocation/deallocation amount of the current call stack, and then performs statistics. The core logic is as follows:
gen_alloc_enter: Set breakpoints (attach_uprobe) at various memory allocation points, such as the entry of malloc, cmalloc, realloc, and other functions (malloc_enter), get the current call stack ID and the size of allocated memory, and record them in a dictionary named sizes;gen_alloc_exit2: Set breakpoints (attach_uretprobe) at the exit of memory allocation functions (malloc_exit), get the starting address of this memory allocation, and at the same time get the size of allocated memory from the sizes field, record (address, stack_info) in the allocs dictionary; meanwhile, useupdate_statistics_addto update the final result dictionary combined_allocs, storing stack information and allocated memory size, count information;gen_free_enter: Set breakpoints at the entry of memory deallocation functions (gen_free_enter), get the corresponding stack information from the previous allocs dictionary based on the starting address of the memory to be freed, then useupdate_statistics_delto update the result dictionary combined_allocs, that is, in the statistics, subtract the total memory allocation and count of the current stack.
GDB Stack Tracing
Now back to the previous question, why can’t the memory allocated by new through tcmalloc be counted? There’s a high possibility that the underlying functions for allocating and freeing memory in tcmalloc are not malloc/free, and are not within the functions where the memleak tool sets probes. So how do we know the memory allocation call chain in the previous example code? A simple method is to use GDB debugging to trace. Note that when compiling the tcmalloc library, include debug information, as follows:
1 | ./configure CXXFLAGS="-g -fno-omit-frame-pointer" CFLAGS="-g -fno-omit-frame-pointer" |
After compilation, you can use objdump to view the header information of the ELF file and the list of each section to verify if there is debug information in the dynamic library, as follows:
1 | objdump -h /usr/local/lib/libtcmalloc_debug.so.4 | grep debug |
Then recompile the binary with the debug version of the dynamic library, use gdb to trace into the internal of the new operator, and get the result as shown in the following figure. We can see that indeed the malloc function is not called.
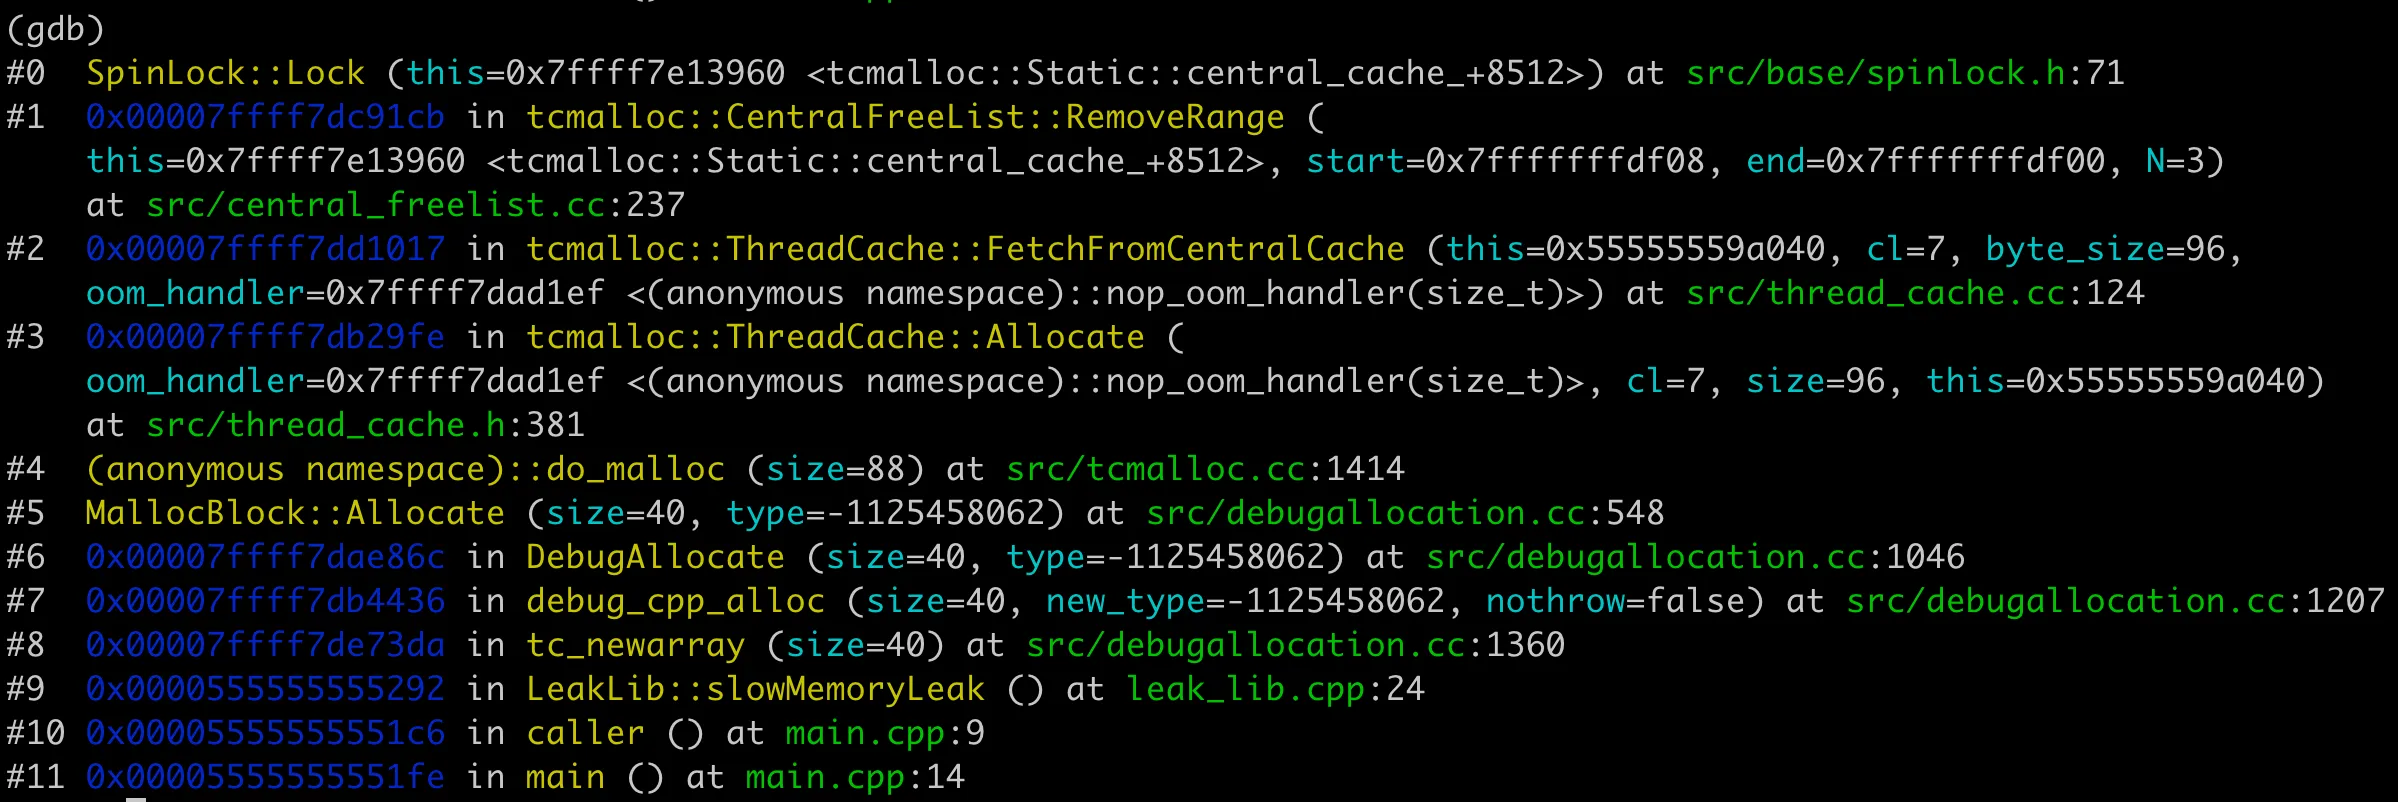
In fact, tcmalloc’s memory allocation strategy is quite complex, with various pre-allocated memory lists inside. When requesting memory spaces of different sizes, there are many strategies to choose the appropriate memory address.
Normal Memory Leak Analysis
In the previous examples, whether using glibc or tcmalloc, when using new to allocate memory, the analysis results obtained by memleak were not perfect. This is because using eBPF to analyze memory leaks must meet two prerequisites:
- When compiling the binary, include the frame pointer. If there are dependencies on standard libraries or third-party libraries, they must also include frame pointers;
- The actual memory allocation function must be within the functions where the tool sets probes, such as malloc, cmalloc, realloc, etc.
So let’s look at the memory leak analysis results after satisfying these two conditions. Modify the memory allocation code in leak_lib.cpp above:
1 | // int* p = new int[arrSize]; |
Then recompile and run the program. Now memleak can get the complete call stack information, as follows:
1 | g++ main.cpp leak_lib.cpp -o main -fno-omit-frame-pointer -g |
If tcmalloc is used when allocating memory, it’s also possible to get the complete leak stack.
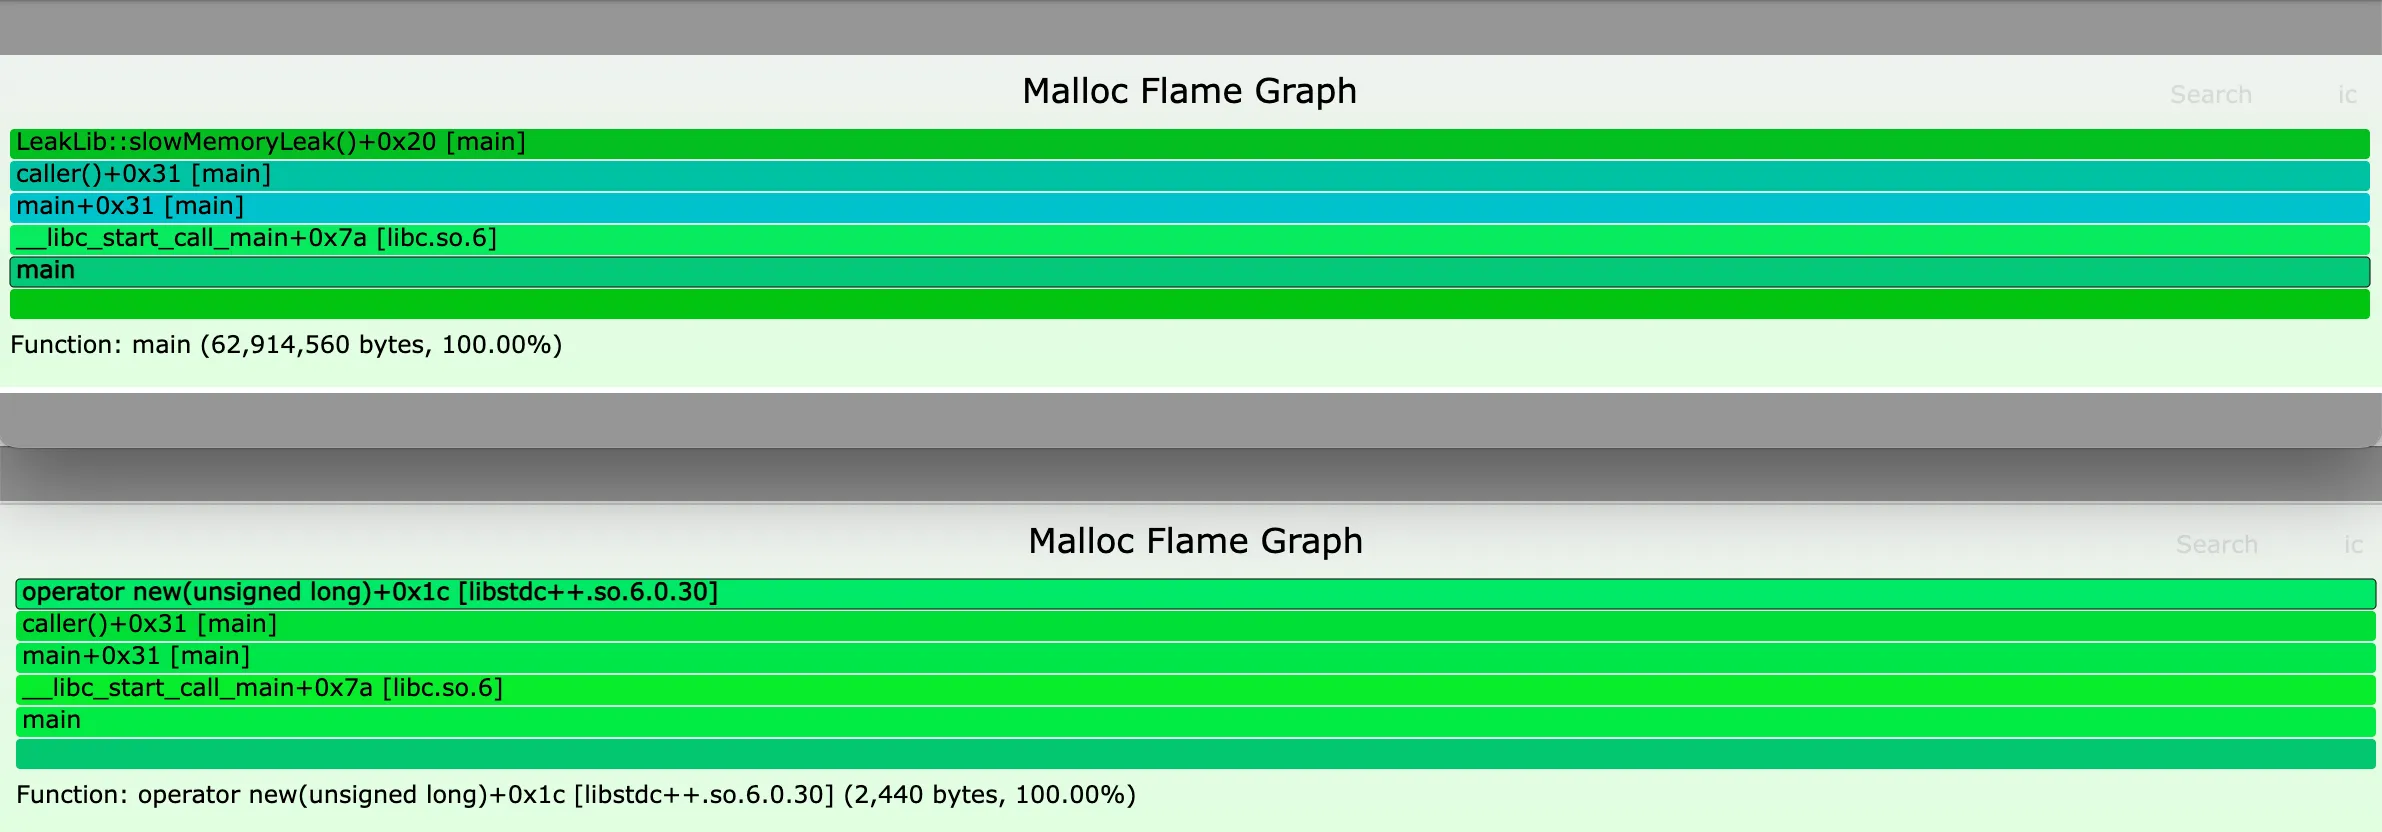
Memory Flame Graph Visualization
In my previous article Frame Pointer Retention and eBPF Performance Analysis in Complex C++ Projects, when using BCC tools for CPU profiling, we could use FlameGraph to convert the output results into a CPU flame graph, clearly identifying the hot spots in CPU usage. For memory leaks, we can similarly generate memory flame graphs.
The steps to generate a memory flame graph are similar to those for CPU. First, use a collection tool like a BCC script to collect data, then convert the collected data into a format that FlameGraph can understand, and finally use the FlameGraph script to generate an SVG image from the converted data. Each function call corresponds to a block in the image, with the width of the block representing the frequency of that function in the samples, thus identifying resource usage hotspots. The format of each line of data that FlameGraph recognizes is typically as follows:
1 | [Stack trace] [Sample value] |
Here, the “stack trace“ refers to a snapshot of the function call stack, usually a semicolon-separated list of function names representing the path from the bottom of the call stack (usually the main function or the thread’s starting point) to the top (the currently executing function). The “sample value” could be CPU time spent on that call stack, memory usage, or other resource metrics. For memory leak analysis, the sample value can be the amount of memory leaked or the number of memory leak occurrences.
Unfortunately, the current memleak doesn’t support generating data formats that can be converted into flame graphs. However, this is not difficult to modify. PR 4766 has implemented a simple version. Let’s use the code in this PR as an example to generate a memory leak flame graph.
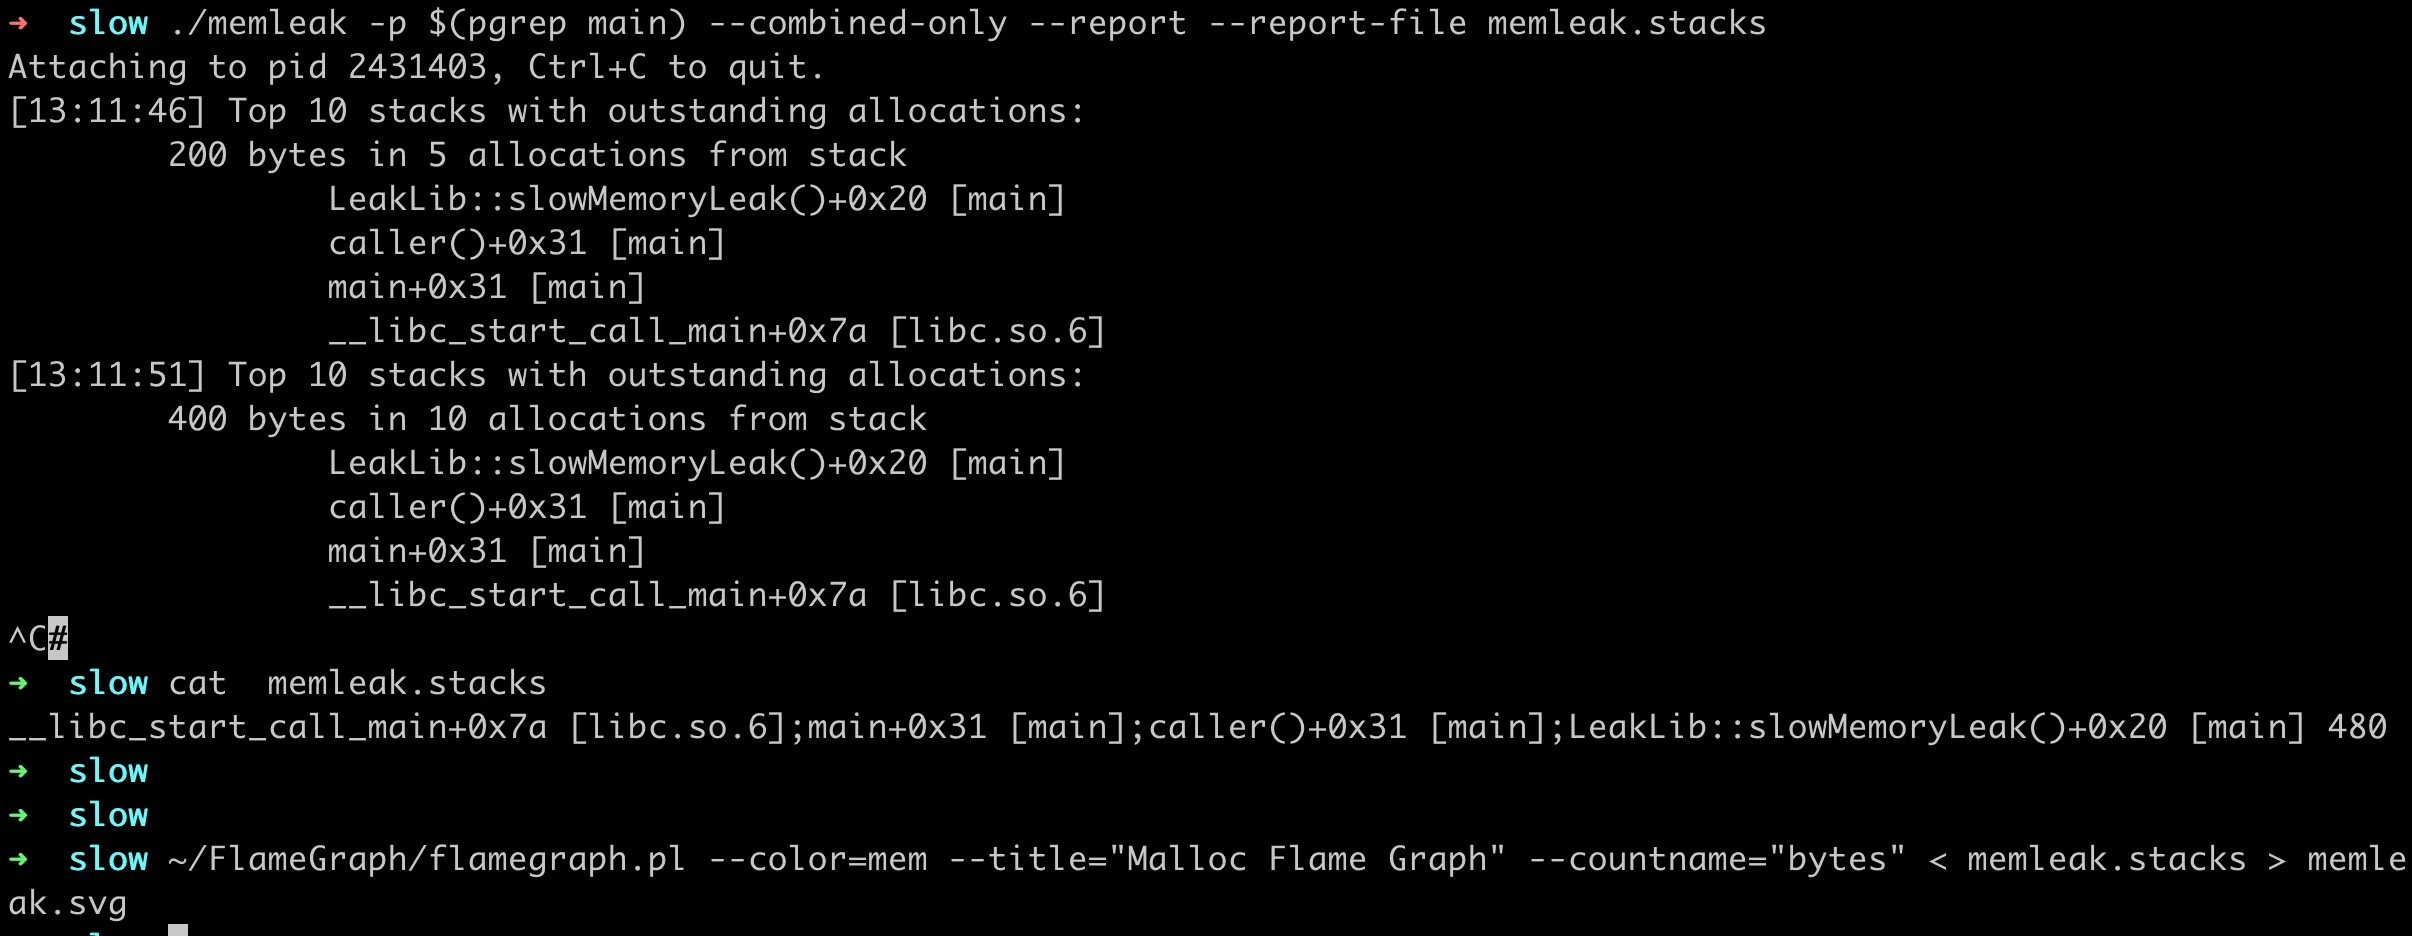
As you can see, the collection file generated here is very simple, in the format mentioned above:
1 | __libc_start_call_main+0x7a [libc.so.6];main+0x31 [main];caller()+0x31 [main];LeakLib::slowMemoryLeak()+0x20 [main] 480 |
Finally, use the FlameGraph script to generate a flame graph, as follows:

Enabling Frame Pointers by Default
At the end of the article, let’s address a controversial topic we left earlier: whether to enable frame pointers by default during compilation. We know that eBPF tools rely on frame pointers to perform call stack tracing. In fact, there are several methods for stack tracing, such as:
- DWARF: Adds stack information to debug information, allowing for tracing without frame pointers, but the downside is poor performance as stack information needs to be copied to user space for tracing;
- ORC: A format created in the kernel for unwinding the stack, with the same purpose as DWARF but much simpler. It cannot be used in user space;
- CTF Frame: A new format that is more compact than eh_frame, unwinds the stack faster, and is easier to implement. It’s still in development, and it’s uncertain when it will be available for use.
So if you want to get complete stack information with relatively low overhead, frame pointers are currently the best method. If frame pointers are so good, why aren’t they enabled by default in some places? In the Linux Fedora distribution community, whether to enable this option by default sparked intense discussion. Eventually, a consensus was reached that in Fedora Linux 38, all libraries would be compiled with -fno-omit-frame-pointer by default. For detailed process, see Fedora wiki: Changes/fno-omit-frame-pointer.
The wiki above has a performance benchmark on the impact of enabling frame pointers. The results show:
- Kernels compiled with GCC using frame pointers are 2.4% slower;
- Building libraries like openssl/botan/zstd with frame pointers didn’t have a significant impact;
- For CPython’s benchmark tests, the performance impact is between 1-10%;
- Redis benchmark tests showed virtually no performance impact;
Of course, it’s not just the Fedora community that tends to enable this by default. Famous performance optimization expert Brendan Gregg suggested in a presentation that -fno-omit-frame-pointer should be set as the default compilation option in gcc:
• Once upon a time, x86 had fewer registers, and the frame pointer register was reused for general purpose to improve performance. This breaks system stack walking.
• gcc provides -fno-omit-frame-pointer to fix this – Please make this the default in gcc!
Additionally, in a paper about DWARF unwinding, it’s mentioned that a Google developer shared that Google’s core code is compiled with frame pointers.
Reference Articles
Exploration of General Analysis Methods for Memory Leaks (Growth) Based on eBPF
Memory Leak (and Growth) Flame Graphs
DWARF-based Stack Walking Using eBPF
Trace all functions in program with bpftrace
Using BPF Tools: Chasing a Memory Leak
TCMalloc Overview

