Analysis of Coredump Caused by Missing Bazel Dependencies
Recently, I encountered a strange coredump problem in a project, and the troubleshooting process was not smooth. After continuous analysis, I found a reproducible step, and through reasonable guessing and careful verification, I finally located the cause.
Looking back, I found that this type of coredump problem is indeed rare and not easy to troubleshoot. It’s only possible when the project code compilation dependency management is not very reasonable. Additionally, during the review process, I gained a better understanding of the coredump and C++ object memory distribution here. So I’ve organized an article, and if there are any errors, please feel free to point them out.
Problem Description
First, let’s talk about the basic architecture of the backend service. The outermost layer is the CGI layer handling HTTP requests forwarded by Nginx, and then the specific business is processed in the middle logic layer. The logic layer is a microservice framework, with different services communicating through RPC calls, using something similar to grpc.
In a certain change, a field was added to an RPC request parameter (for example, age below) in the service.proto file of service A:
1 | service Greeter { |
Then, the related logic for this field was added, and subsequently, the module was compiled and deployed. We know that in microservice architecture, it’s common for multiple services to share the same proto object. If you need to modify the proto, it’s generally done by adding fields, which is compatible with both the caller and the callee. After service A is deployed with the new proto, other services using this proto will use the old version until they are recompiled, which shouldn’t cause problems. Strictly speaking, this can potentially cause issues, which I’ve encountered before, mainly related to Merge compatibility problems. You can refer to my previous article Analysis of Storage Failure Caused by Protobuf Serialized Messages.
Normally, if other services want to update the proto, they just need to recompile to use the new proto, which shouldn’t cause any problems. However, this time there was an issue: after service A’s proto added a field and was deployed, other services calling A through the client would coredump as soon as they were recompiled and deployed.
Reproduction Steps
After looking at the core file from the production environment, I didn’t find particularly useful information (my skills in locating problems through core files are still not sufficient). So I thought about trying to reproduce it stably first, after all, for core problems, if you can reproduce them stably, the problem is basically half solved. Fortunately, after some attempts, I found a step that could stably reproduce the issue.
Old Version Proto
Create an initial version of the proto file, let’s call it data.proto, and compile it with protoc to data.pb.h and data.pb.cc. The content of the proto file is as follows:
1 | syntax = "proto3"; |
The compilation command is simple, just protoc --cpp_out=. data.proto. In addition, there’s a libdata.cpp file that defines a processData function using the above proto object. This cpp file is compiled into a public library libdata.so:
1 | // libdata.cpp |
The command to compile it into a dynamic library is as follows:
1 | g++ -fPIC -shared libdata.cpp data.pb.cc -o libdata.so -lprotobuf -g |
Now we have the libdata.so dynamic library file.
Updating Proto
Next, let’s modify the data.proto file and add a repeated field, as follows:
1 | syntax = "proto3"; |
Then recompile the proto file with protoc. Next, write our main program, let’s call it main.cpp, which simply calls the function in the libdata.so library. The content is as follows:
1 | // main.cpp |
Then compile and link our main program with the following command:
1 | g++ main.cpp -o main -L. -lprotobuf -Wl,-rpath,. -ldata -g |
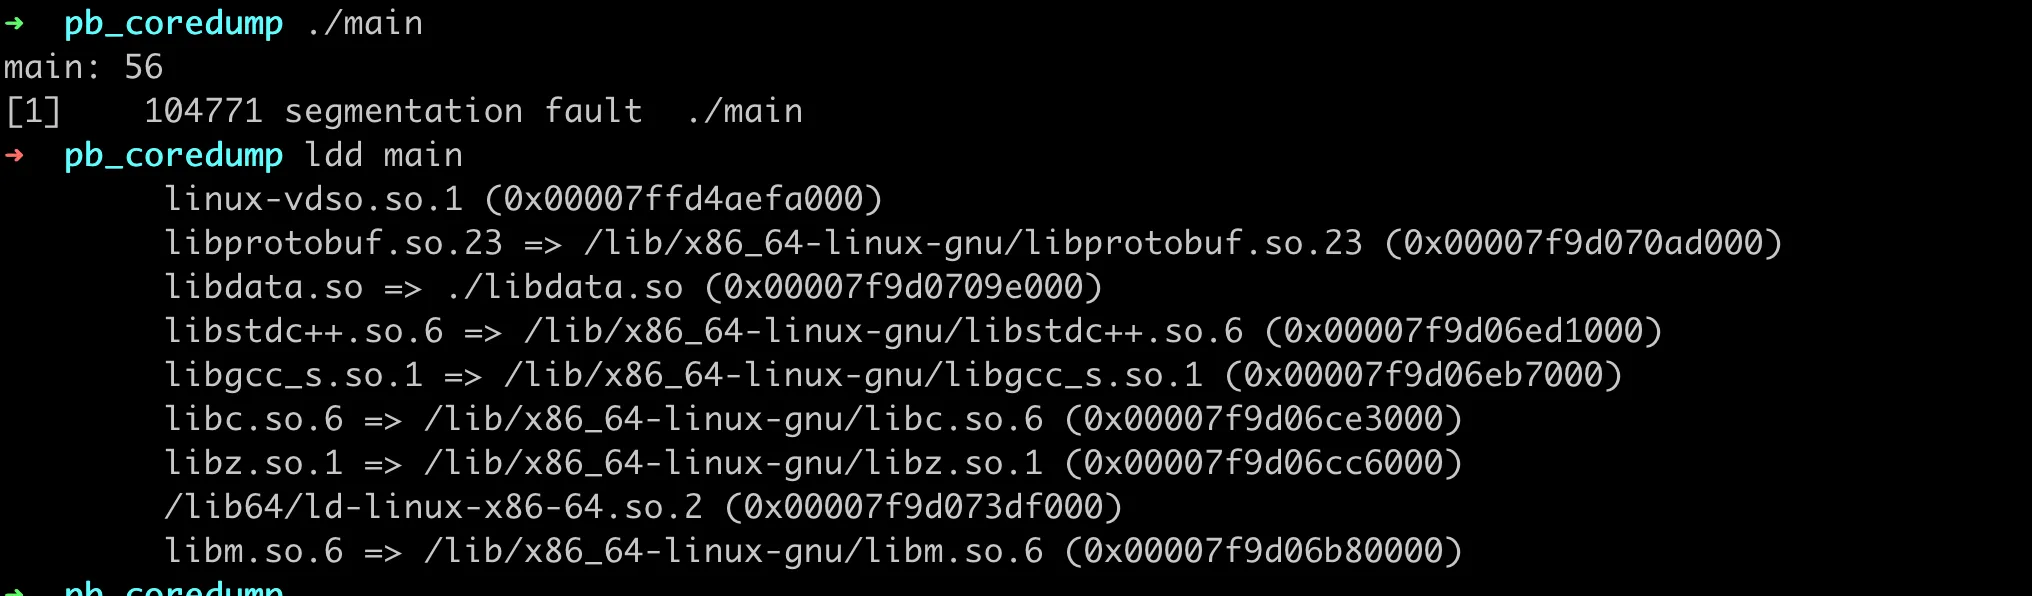
Note that our libdata.so library file is in the current directory, so we need to use -Wl,-rpath,. to specify the search path for dynamic libraries. Then run the program, and it will reproduce the coredump, as shown in the following figure:
In-depth Analysis
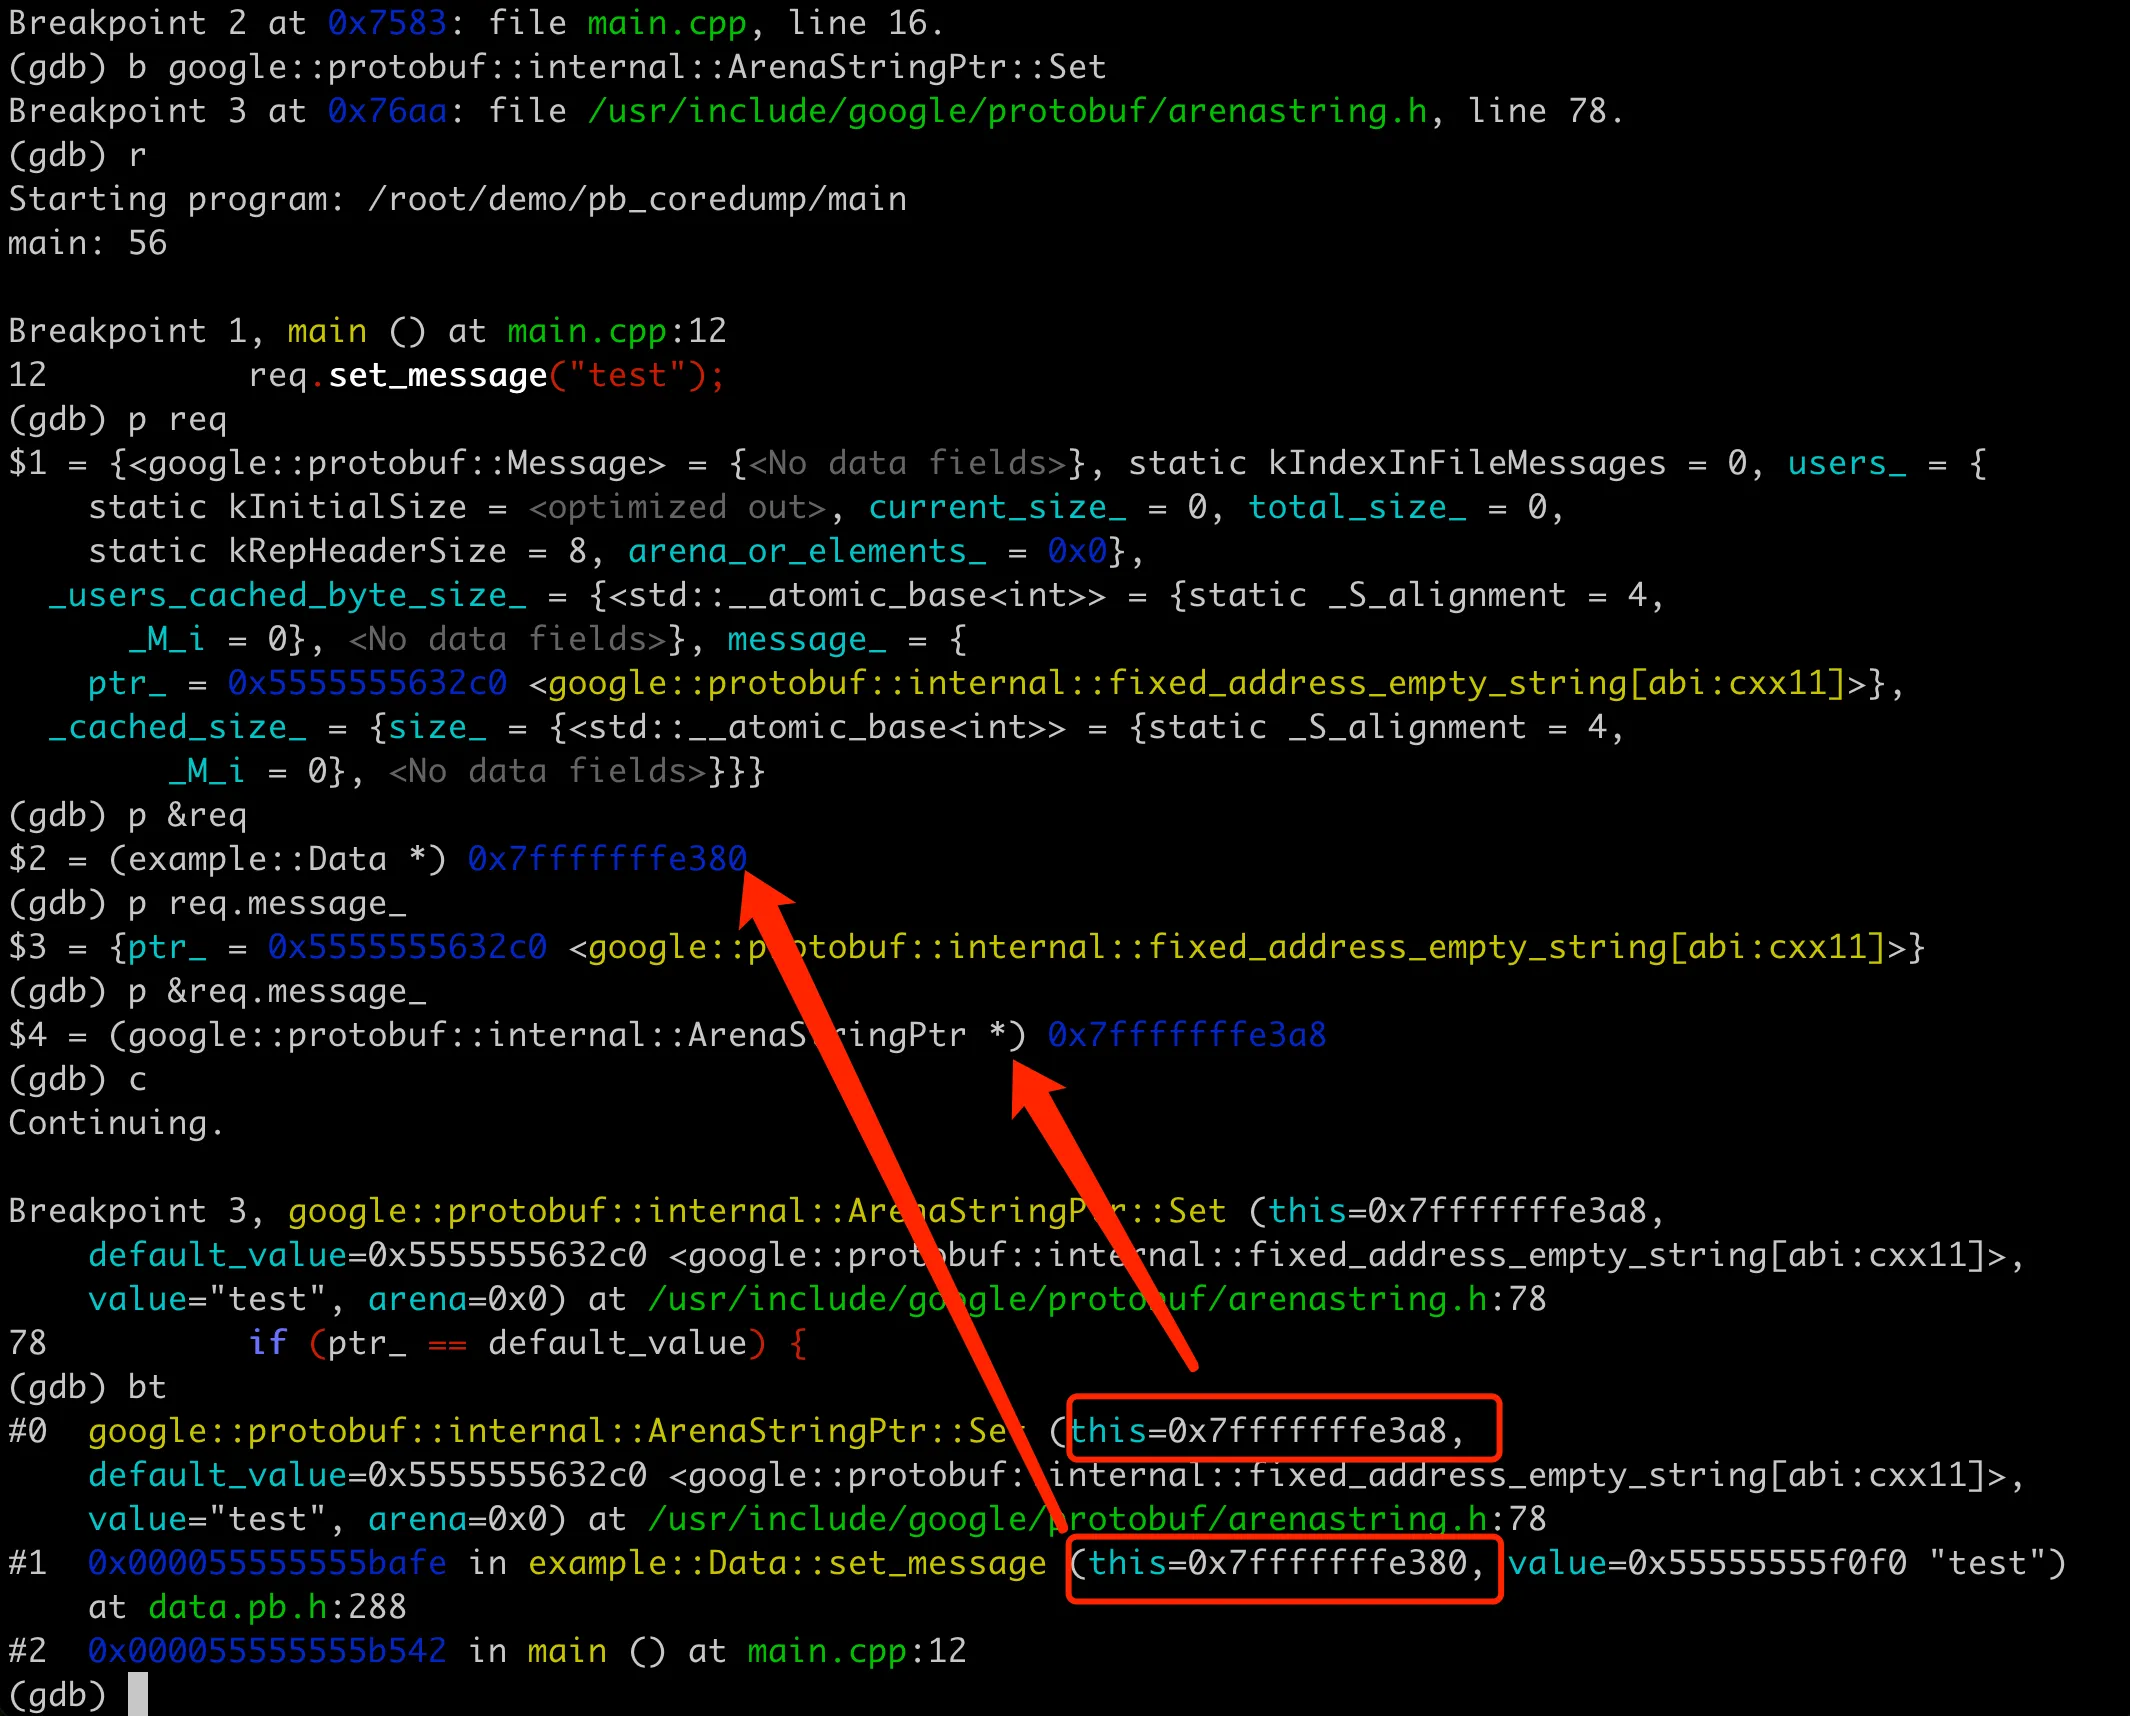
Most of the time, if you can stably reproduce a coredump, it’s basically easy to find the cause of the coredump. Compile with -g to include debugging information, and then you can use gdb to trace and investigate. Since it will core dump at set_message, we can set a breakpoint here, first check the memory layout of the req object, then execute until the core dump, and check the stack. The overall result is as follows:
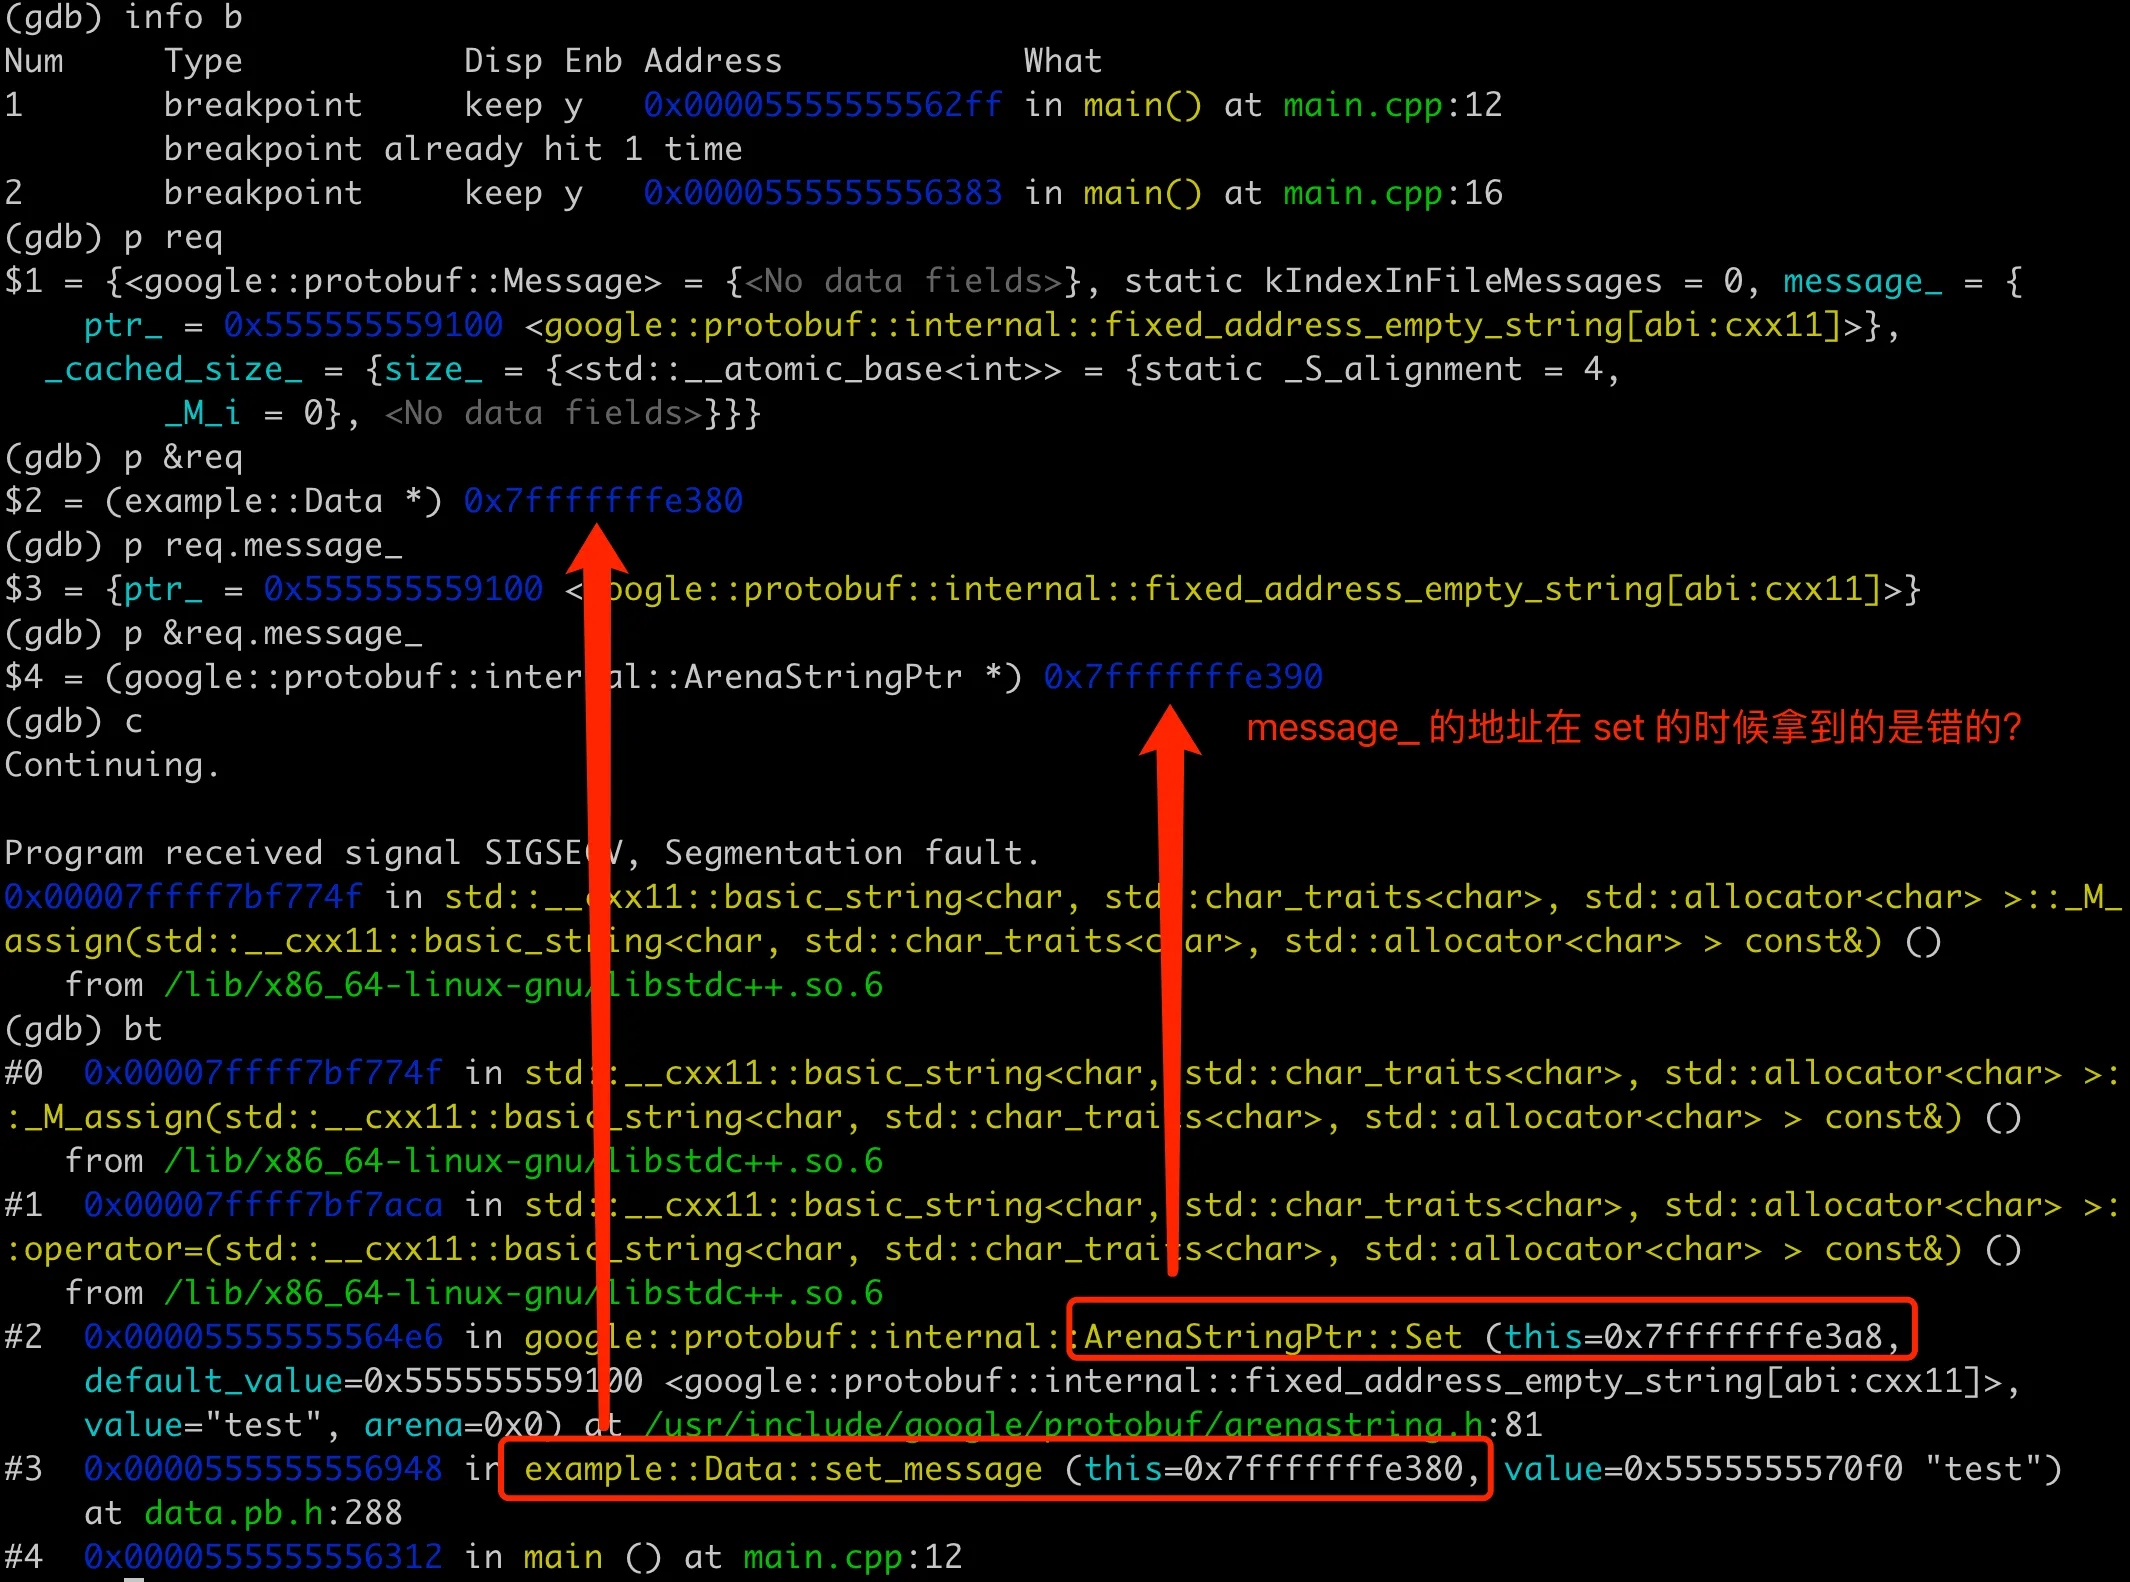
First, use GDB to print the contents of req. Strangely, there’s only the message field here, and the users field is not visible. Then execute to req.set_message("test");. From the coredump stack, we can see that the this and value addresses in set_message are fine. But when ArenaStringPtr::Set is called at the bottom, the this address is 0x7fffffffe3a8, which seems to be the address of the message field. From the previous output, it should be 0x7fffffffe390 (not sure about this, we’ll verify it later).
1 | (gdb) bt |
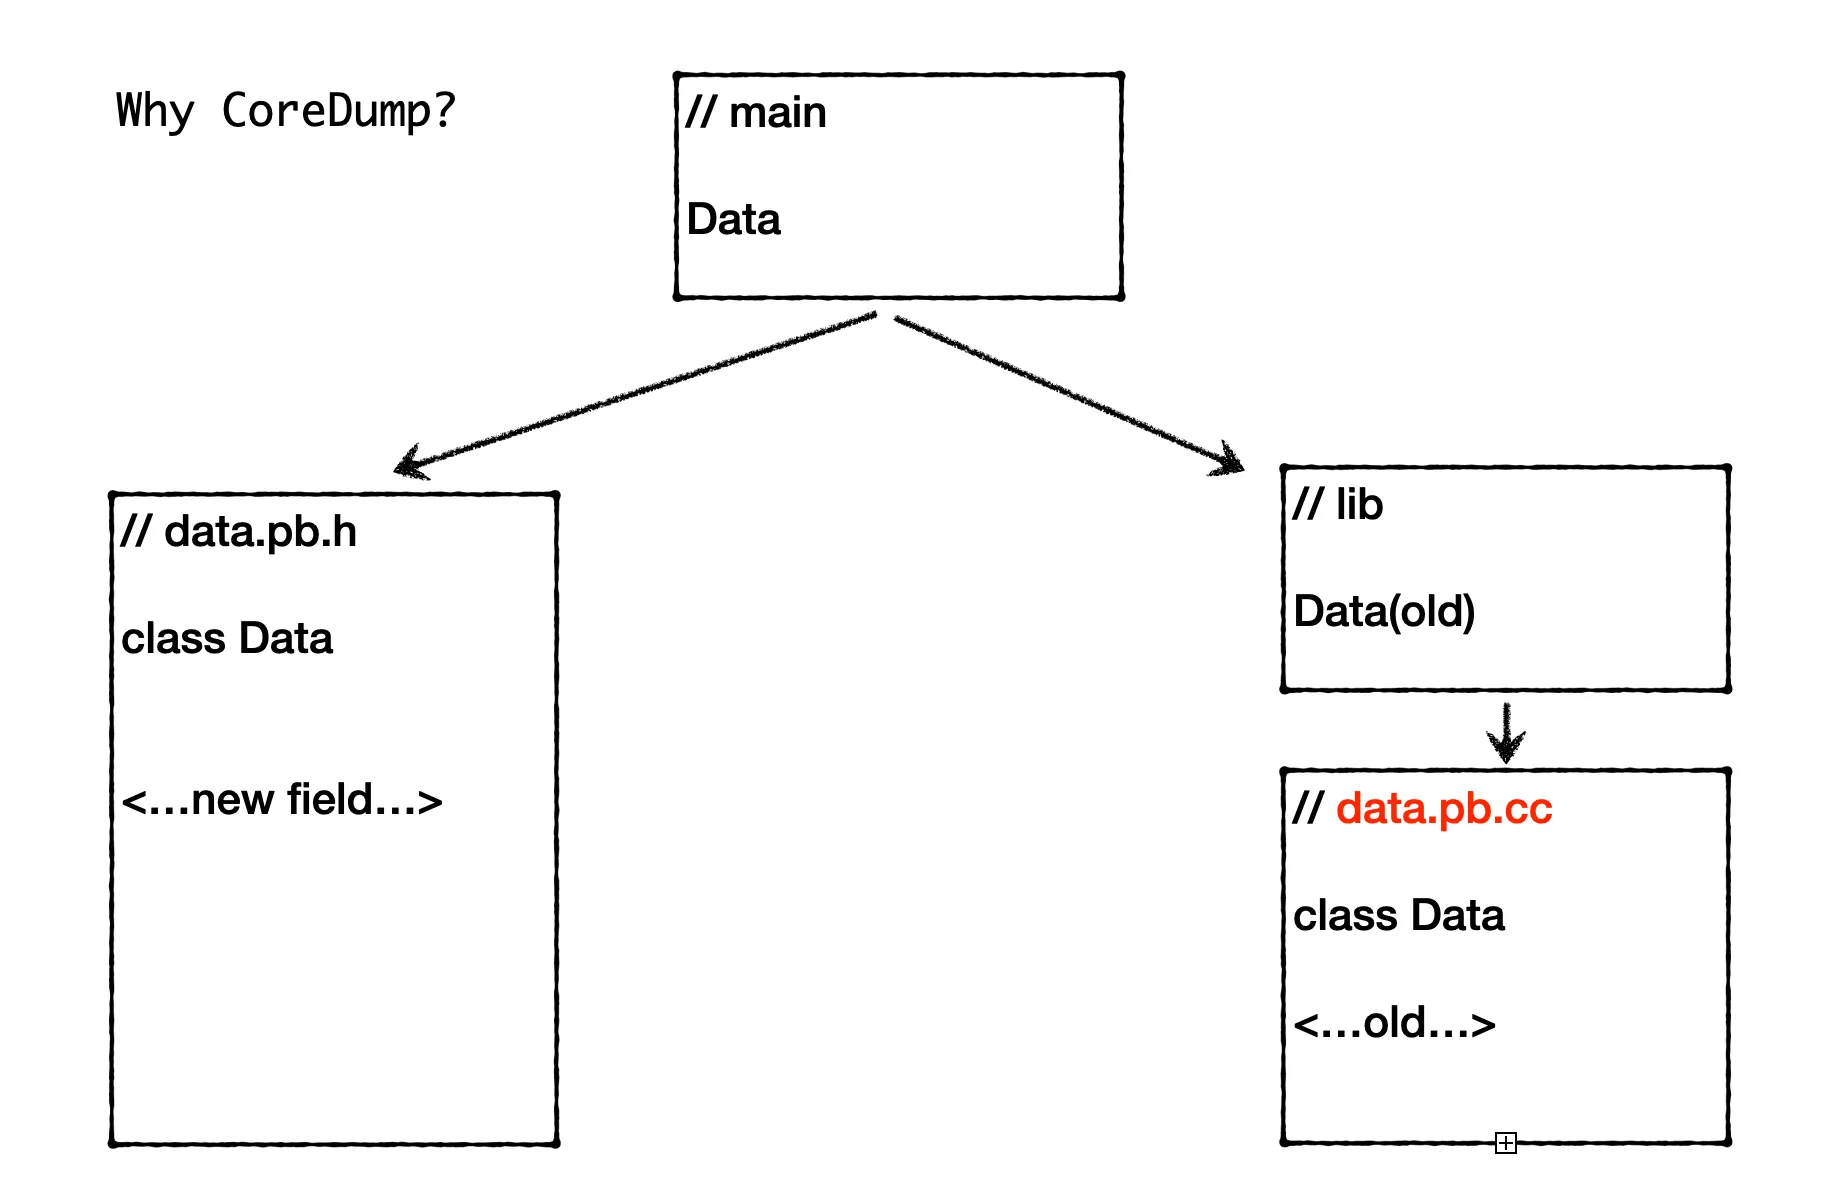
The direct cause of the coredump is that the memory address of the message field is incorrect. So what caused the memory address to be wrong? Here we need to review our compilation and running process. We know that in C++, the memory layout of objects is determined by the definition of their class, which is usually given in the header file (.h). When compiling a C++ program, the compiler determines the size and memory layout of each object based on the class definition (including the type, number, order of member variables, etc.). Specifically for the C++ classes generated by Protobuf here, the class definitions are usually contained in the .pb.h file, while the .pb.cc file contains the implementations of the methods of these classes, including field accessors (such as set_message and message) and implementations of other member functions. These implementations are responsible for actual data operations, such as allocating memory, modifying field values, generating string representations of objects, etc.
Object Memory Distribution
In our compilation process above, the main program main.cpp uses the new version of data.pb.h, so the Data object in main is compiled according to the new memory layout. The memory layout of the object here includes the arrangement of member variables, the total size of the object, and possible padding (to meet alignment requirements), so the Data object in main includes the users field. How do we verify this? It’s simple, we can print the size of the Data object in main, as follows, first comment out the set_message and code that reads message which would cause coredump:
1 | // main.cpp |
Then recompile and link, run the program, the output is as follows:
1 | main: 56 |
We can see that the size of data in main is 56, while the size of data in lib is 32. Through this verification, we can confirm that the Data object in main includes the users field, so it will be larger than the Data object in lib.
Since it includes the users field, why when gdb prints the req object in main.cpp, it doesn’t include the users field? We know that GDB can output object members, local variables and other information because it uses the symbol table information in the binary file. The -g option in gcc compilation will include this debugging information. For pb objects, this debugging information is in the .pb.cc file, including logic on how to serialize and deserialize fields, how to manage memory (including handling dynamically allocated fields such as strings and repeated fields), etc.
If we carefully review the compilation and linking command for main earlier, we actually linked to the old data.pb.cc implementation in the dynamic library libdata.so, and this version of the implementation doesn’t have the users field. So when gdb prints, it can’t display it.
1 | g++ main.cpp -o main -L. -lprotobuf -Wl,-rpath,. -ldata -g |
Actually, there’s another question that needs to be explained here: why didn’t the program core dump when we commented out the set_message and code that reads message earlier? This is because the main program no longer attempts to modify or access the contents of the req object. Although the memory layout of the req object doesn’t match that in libdata.so, since there’s no actual operation on these inconsistent memory areas, it doesn’t trigger illegal memory access.
Linking New Version PB
Earlier, when we linked main, we used the old data.pb.cc in the dynamic library. What if we change to link the new data.pb.cc? Will the program still core dump? Let’s slightly modify the previous compilation and linking command, note that the set_message part in main.cpp is still commented out:
1 | g++ main.cpp data.pb.cc -o main -L. -lprotobuf -Wl,-rpath,. -ldata -g |
The new linking command only needs to put data.pb.cc before -ldata to link to the new pb implementation. For the process of link symbol resolution here, you can refer to my previous article Deep Understanding of C++ Link Symbol Resolution: Starting from Symbol Redefinition.
After compiling and running the program, we found that it indeed core dumped again, but this time the core dump location is in the processData function in libdata.cpp, specifically at data.set_message("Hello from lib");, as shown in the following figure:
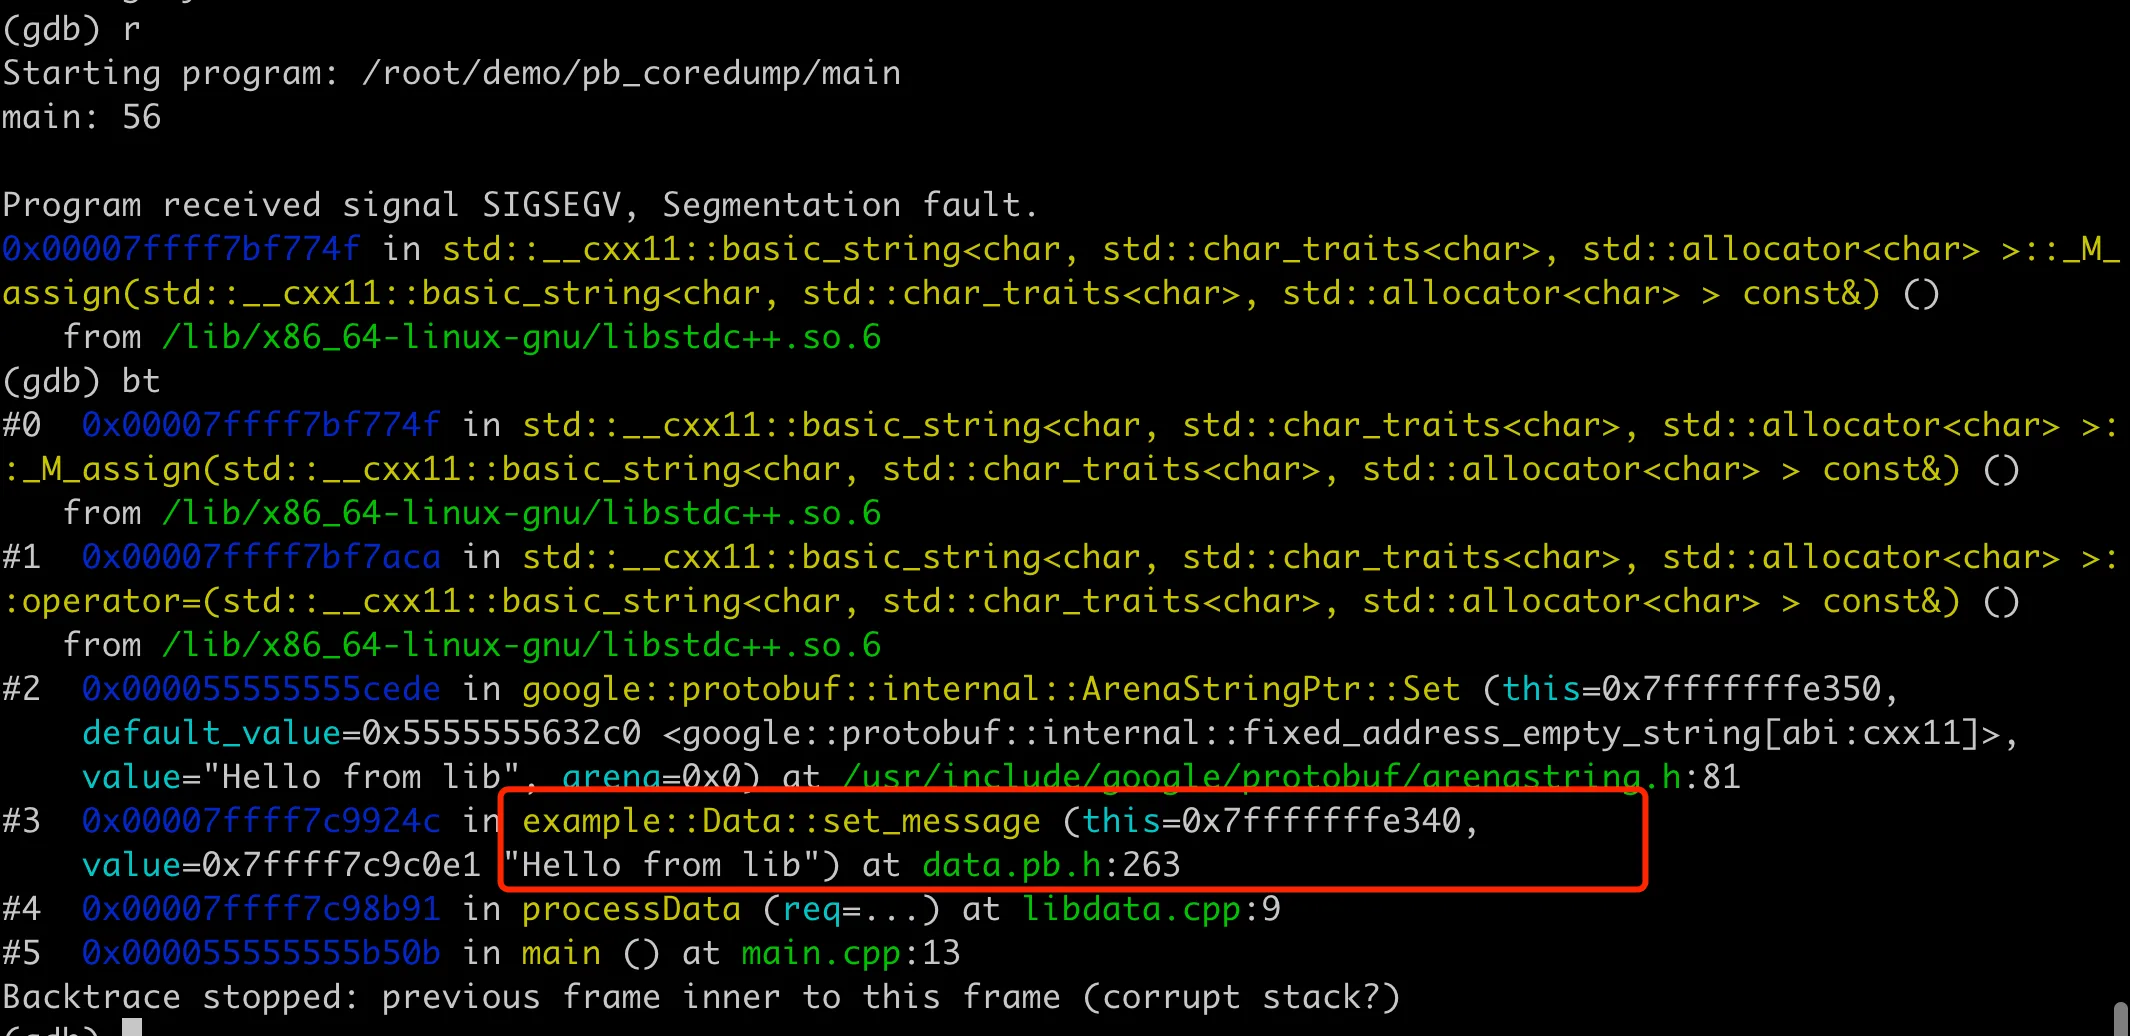
This is because the Data object definition in our libdata.so uses the old data.pb.h, while the implementation linked to is the new data.pb.cc, causing object inconsistency, so memory will be scrambled leading to core dump.
The location of the core dump here is also quite interesting. If we don’t comment out the set_message part in main.cpp, like this:
1 | int main() { |
The program didn’t core dump in the processData of the dynamic library, but instead core dumped at req.message() in main. This is probably because the object access in processData coincidentally didn’t scramble, until accessing req.message() in main triggered the memory error. So what if we also comment out the req.message() line? Will the following code still core dump?
1 | int main() { |
After execution, we found that the program ran to return, printed all the content, but still core dumped at the end. The output is as follows:
1 | g++ main.cpp data.pb.cc -o main -L. -lprotobuf -Wl,-rpath,. -ldata -g |
The specific core dump location is in the destruction process of the req object in main. Through GDB, we can find that before processData processing, printing req can also see the user field. But after processData, the memory address of req directly becomes an invalid address, so the subsequent destruction fails. The overall GDB process is as follows:
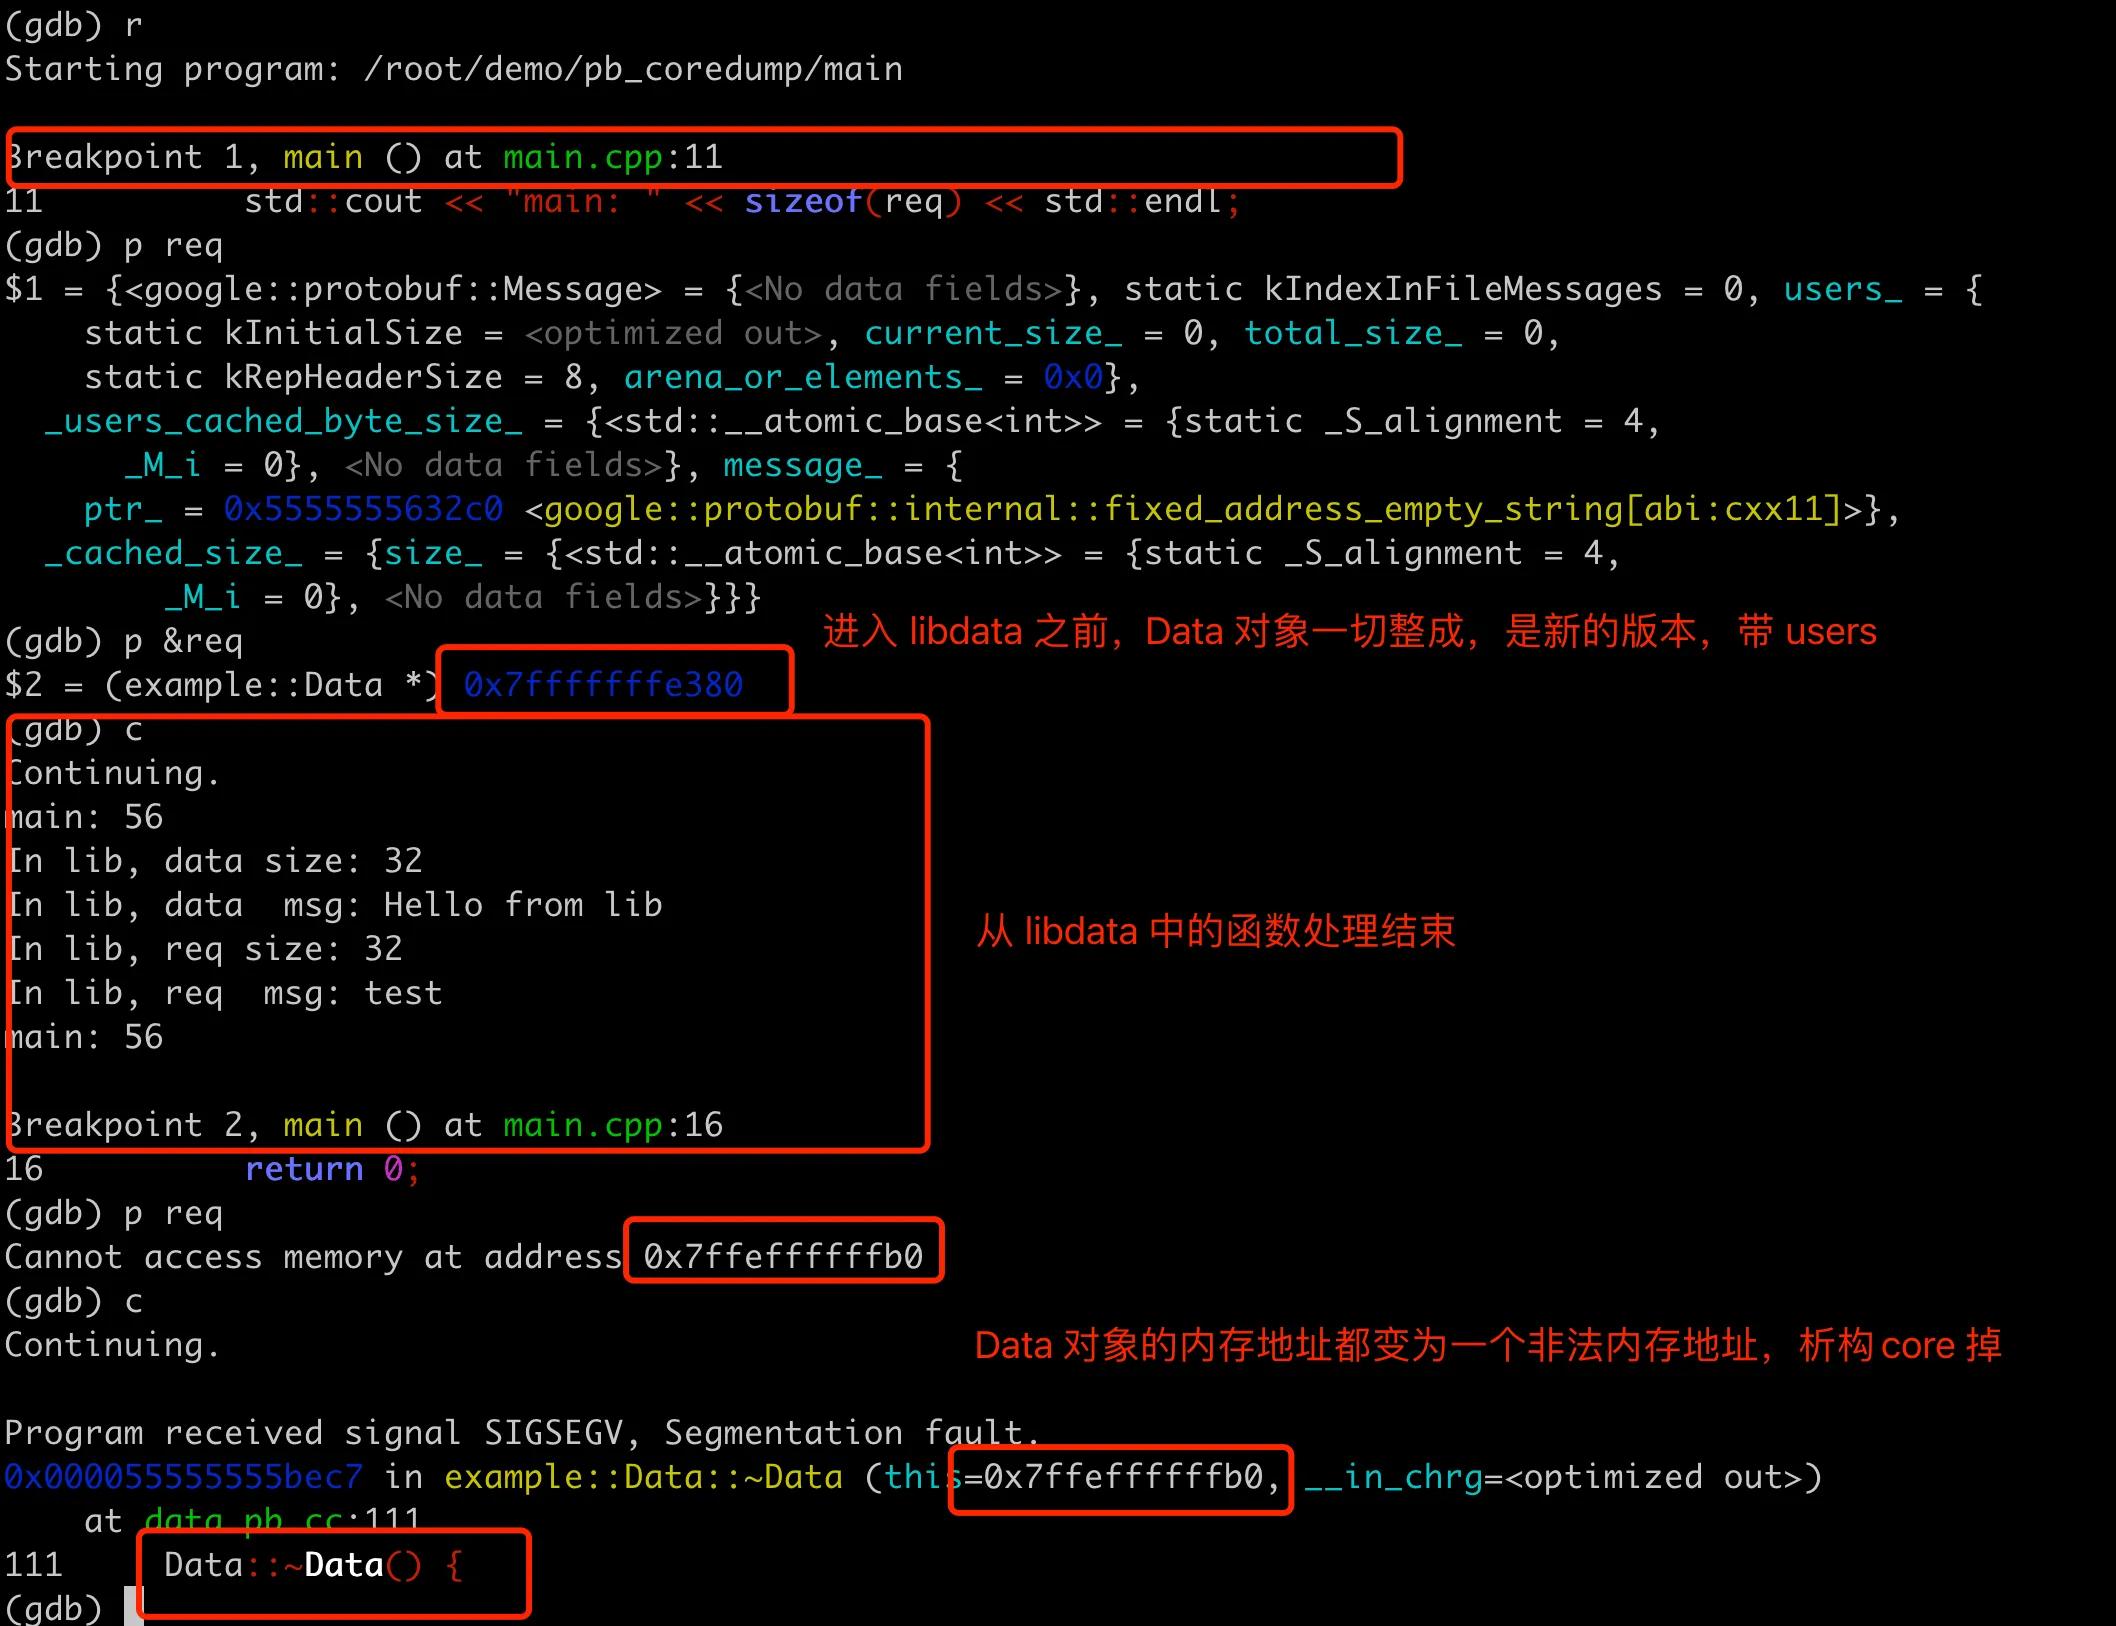
To add a bit more here, actually when processing req in processData, because there are two versions of the definition and implementation of the Data object, it causes the memory address of req to be scrambled. It’s just a coincidence that the operations in this function didn’t core dump due to memory issues, until the destruction in main finally triggered the core dump.
Memory Analysis in Normal Situations
The root cause of the program’s core dump above is that different versions of data.pb.h and data.pb.cc were used in one executable file, leading to abnormal memory reading and writing. Next, let’s look at how the memory distribution of pb objects is in the entire process under normal circumstances. At the same time, let’s verify a guess we left earlier: when ArenaStringPtr::Set is called at the bottom layer, the this address is 0x7fffffffe3a8, which is the address of the message field.
First, regenerate the dynamic library using the new version of data.pb.cc, then recompile the main program. The running result is as follows, everything is normal.
1 | ./main |
Then let’s analyze it using GDB. We can print the req object, which contains the users and message fields. Get the address of message, and we can see that it’s the same as the this address in the subsequent ArenaStringPtr::Set. Moreover, after being processed by processData, the memory address of the req object here hasn’t changed, indicating that the memory operation here is normal. The overall GDB process is as follows:
Bazel Dependency Missing
Let’s return to the business background introduced at the beginning of the article. The C++ project in the business has many dependencies and uses Bazel for dependency management. The problematic BUILD file is roughly as follows:
1 | proto_library( |
The dependency of libdata here is actually incomplete. Normally, it should depend on data_cc_proto, but it doesn’t here. After updating data.proto, when recompiling main, Bazel analyzes the dependency relationship and finds that data.proto is not used in the declared dependencies (although it’s actually depended on), so it won’t recompile libdata. This causes the Data object definition in libdata to still be the old version, while the Data object in main will use the new version, leading to memory scrambling as before, and ultimately causing a coredump.
In fact, for libdata to compile successfully, it needs to find the data.pb.h header file. Here, the includes = ["."] approach is used, which allows a rule and all its transitive dependencies to include header files from any location within the workspace. This approach has many problems, such as reducing the encapsulation and maintainability of the library and slowing down the build speed. The latest version of Bazel has actually prohibited this approach, and it’s not recommended in older versions of Bazel either.
In our project, because we need to be compatible with a relatively old version of protobuf (around version 2.6, which is also very old), we’re using an old version of Bazel, roughly the 2017 version. In the BUILD file, include=['.'] is also widely used, causing the dependency paths of header files to be very messy. So although the lib library’s dependency relationship is incomplete, it can still compile, laying the groundwork for subsequent coredumps. If upgraded to a new version of Bazel, the dependency management would be stricter, making it easier to discover such missing dependency BUILD writings.
Conclusion
Finally, let’s summarize briefly. The problem started with simply adding a field to the proto, unexpectedly leading to a coredump. Although we knew it was related to the field addition change, it still took a lot of time to analyze the specific cause.
Many troubleshooting directions were attempted in the process:
- Is there a bug in the protobuf library? Searched around but didn’t find similar issues, and it has been very stable after using it for so long, so this possibility was ruled out first.
- Analyzed the coredump file but didn’t find useful information. On one hand, this was because I’m not very familiar with the implementation of protobuf, so I didn’t know where to start when it core dumped in pb. On the other hand, my skills in analyzing cores with GDB are not very deep.
- Continuously stripped away irrelevant logic, trying to find a small demo that could reproduce the issue. Here, a colleague finally found a reproducible step, which became the breakthrough. After the colleague stably reproduced it, it became relatively easy to guess and verify that it was related to using different versions of the proto.
Then, thinking about writing an article to record this uncommon pitfall, I encountered another problem when preparing the code for the article review. When my colleague reproduced it earlier, there was actually a lot of project code logic involved, and the Bazel dependency relationships were quite complex. In the article, I wanted to use the simplest code to reproduce and explain the problem. At first, when simulating the proto modification, I only added a string field, but found that it didn’t cause a coredump. Although the memory layout of the Data object was different here, it coincidentally read and wrote memory normally, not triggering illegal memory access. Later, I thought about increasing the “disturbance” here and tried switching to repeated, which could stably reproduce the coredump.
One advantage of having sufficiently simple review code is that it’s also convenient to debug with GDB, without too much irrelevant information. By comparing the changes in object memory addresses in core and normal code, it once again verified that the core was indeed caused by using different versions of pb objects. However, this article still lacks some depth, not going into a deep analysis of why different versions of pb would cause address scrambling, which probably requires delving into the implementation of protobuf.
The last question is, how to avoid such problems in the project in the future? First, avoid using include ['.'] which brings chaotic header file search paths, then standardize dependency management, adding dependencies on pb for all libraries that use protobuf. Of course, it would be best to upgrade Bazel if possible, but this would require more manpower.

