Dive into C++ Object Memory Layout with Examples
0 CommentIn the previous article Analysis of C++ Process Coredump Problem Caused by Missing Bazel Dependencies, due to the use of different versions of proto objects in the binary, inconsistent object memory layouts led to memory address chaos when reading and writing members, ultimately causing the process to crash. However, we didn’t delve into the following questions at that time:
- How are objects laid out in memory?
- How do member methods obtain the addresses of member variables?
These actually involve the C++ object model. The book “Inside the C++ Object Model” comprehensively discusses this issue and is well worth reading. However, this book is not easy to read, and some content can be difficult to fully understand without practice even after reading. This article attempts to start from practical examples to help everyone gain an intuitive understanding of C++ class member variables and functions in memory layout, which will make it easier to understand this book later.
Simple Object Memory Distribution
Let’s start with the simplest Basic class as an example to see how objects containing only basic data types are allocated in memory.
1 |
|
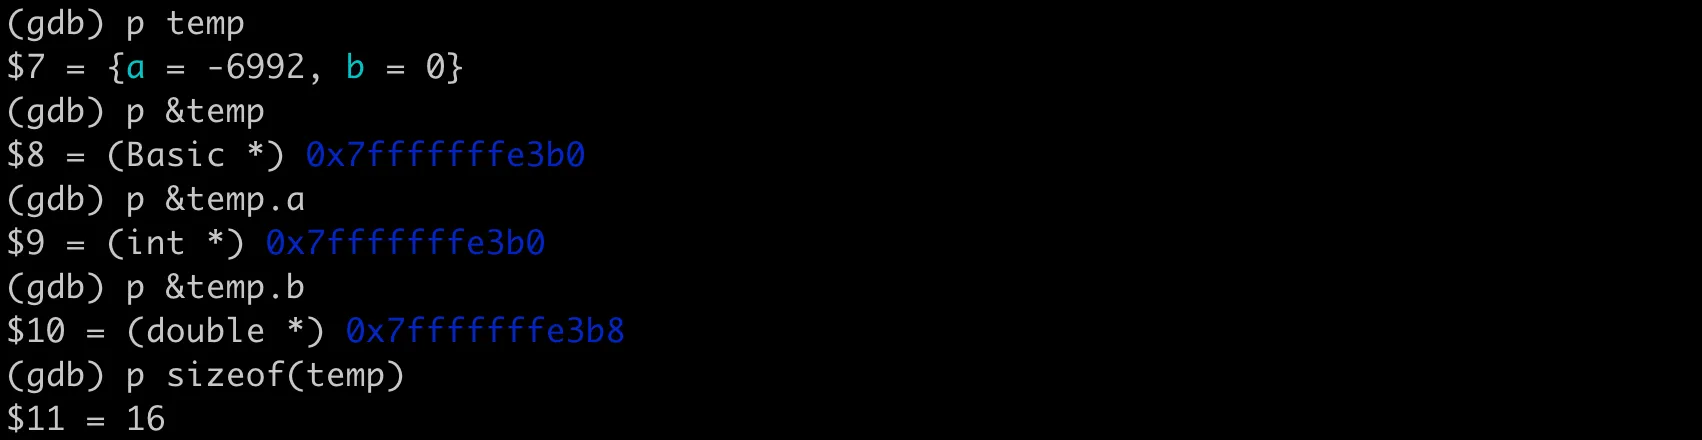
After compiling and running, we can use GDB to examine the object’s memory distribution. As shown in the following figure:
 Basic data class memory distribution - GDB debugging
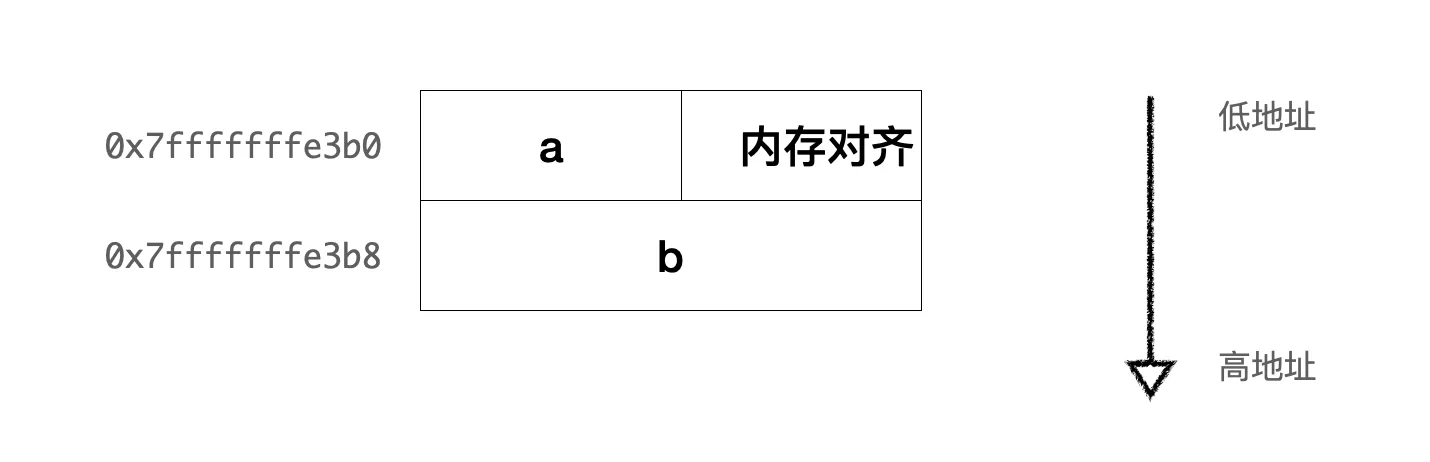
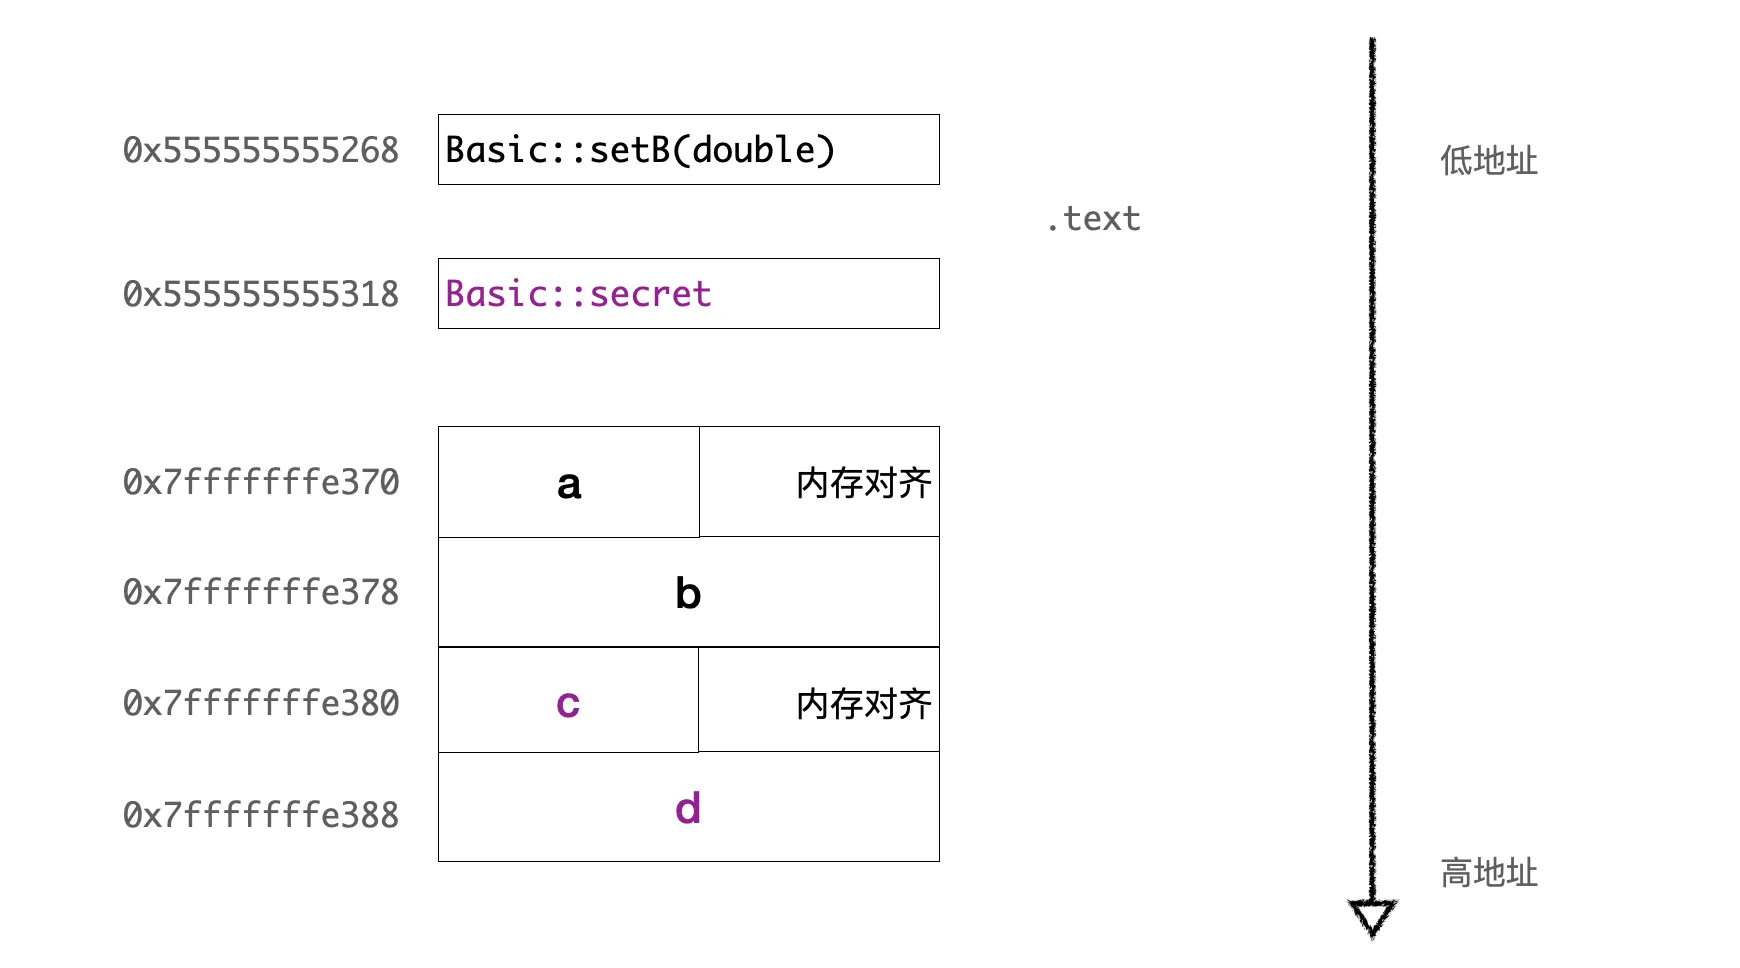
The starting address of the object temp is 0x7fffffffe3b0, which is the location of the entire object in memory. The address of member variable a is also 0x7fffffffe3b0, indicating that int a is the first member in the object temp, located at the starting position of the object. The member variable b is of type double, and its address is 0x7fffffffe3b8 (a’s address + 8). The memory layout is as follows:
 Basic data class memory distribution diagram
Here, the int type occupies 4 bytes on the current platform (which can be verified using sizeof(int)), while the starting address of the double member differs from the starting address of the int member by 8 bytes, indicating the presence of memory alignment padding after a (depending on the compiler’s implementation details and platform alignment requirements). Memory alignment requires that the starting address of data be on a multiple of a specific size (such as 4 or 8), which can optimize the efficiency of hardware and operating system memory access. This is because many processors access aligned memory addresses faster than non-aligned addresses.
Additionally, without memory alignment, larger data structures might span multiple cache lines or memory page boundaries, which would lead to loading additional cache lines or pages, reducing memory access efficiency. However, in most cases, we don’t need to manually manage memory alignment; the compiler and operating system will automatically handle these issues.
Object Memory Distribution with Methods
What about classes with methods? Continuing from the previous example, let’s add a method setB to the class to set the value of member b.
1 |
|
After compiling and running, when we print the addresses of the temp object and its member variables using GDB, we find that the memory layout is exactly the same as before without methods. The entire object size is still 16, and the memory address distributions of a and b are consistent. So where is the newly added member method stored? And how does the member method obtain the addresses of member variables?
Member Method Memory Layout
We can print the address of the member method in GDB, as shown in the following figure.
 Storage address of member method
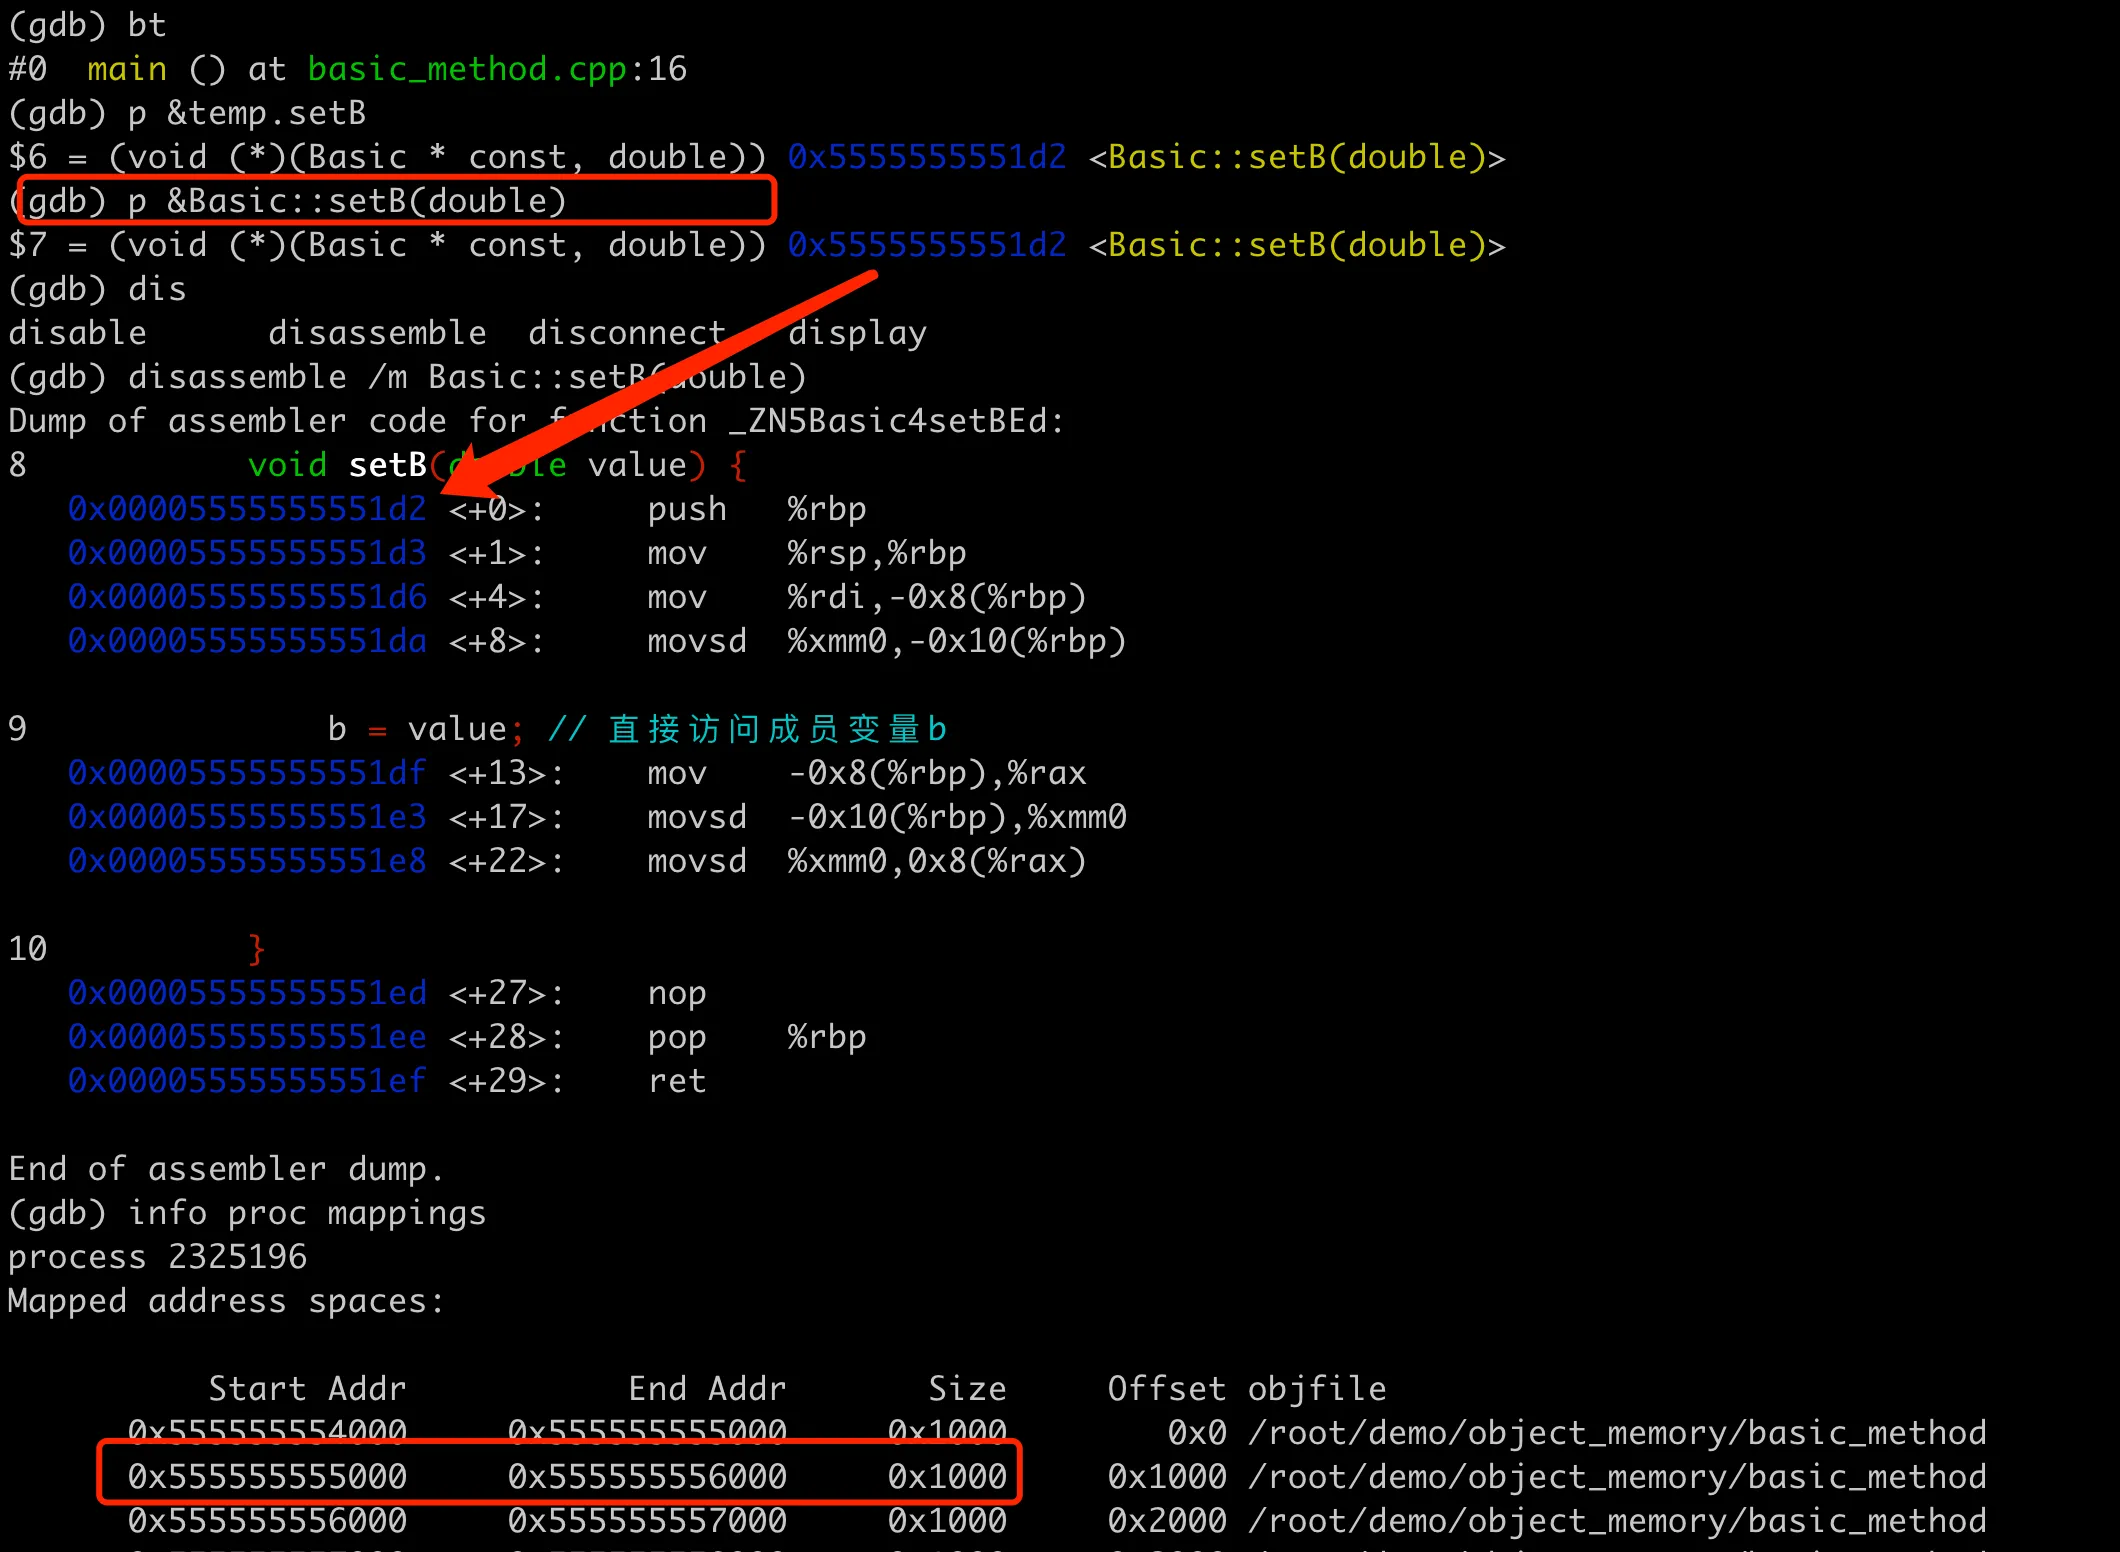
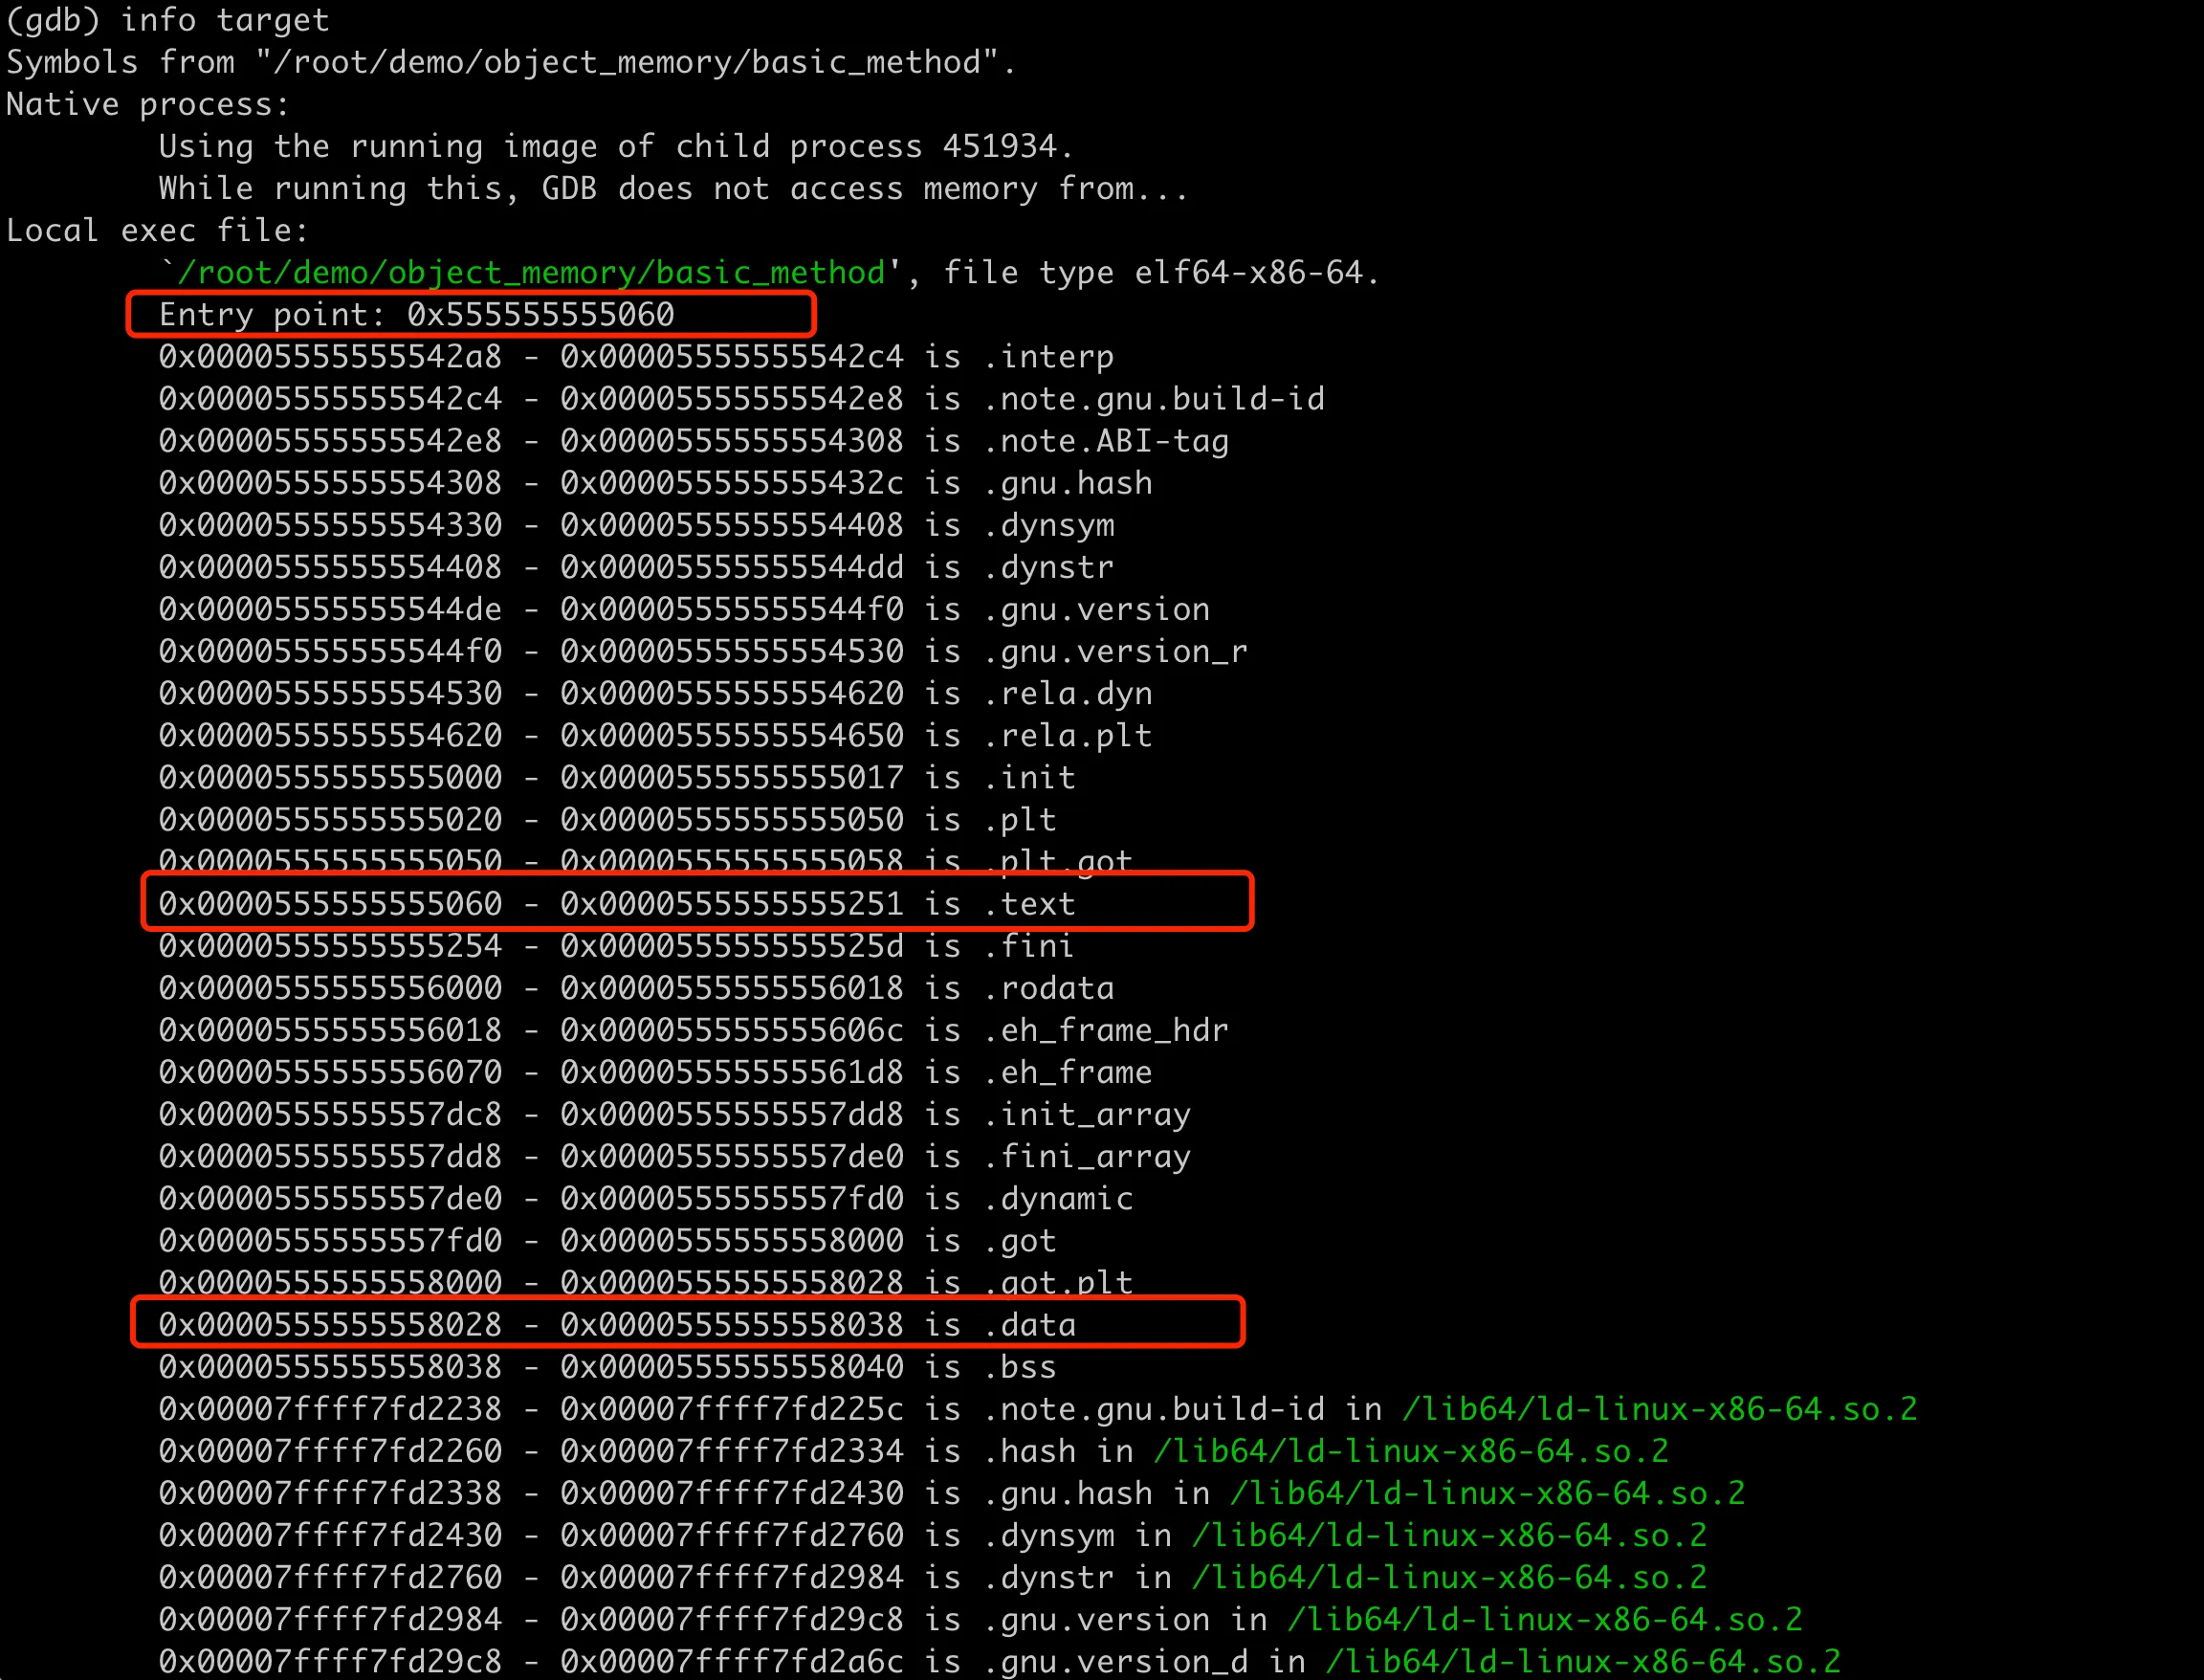
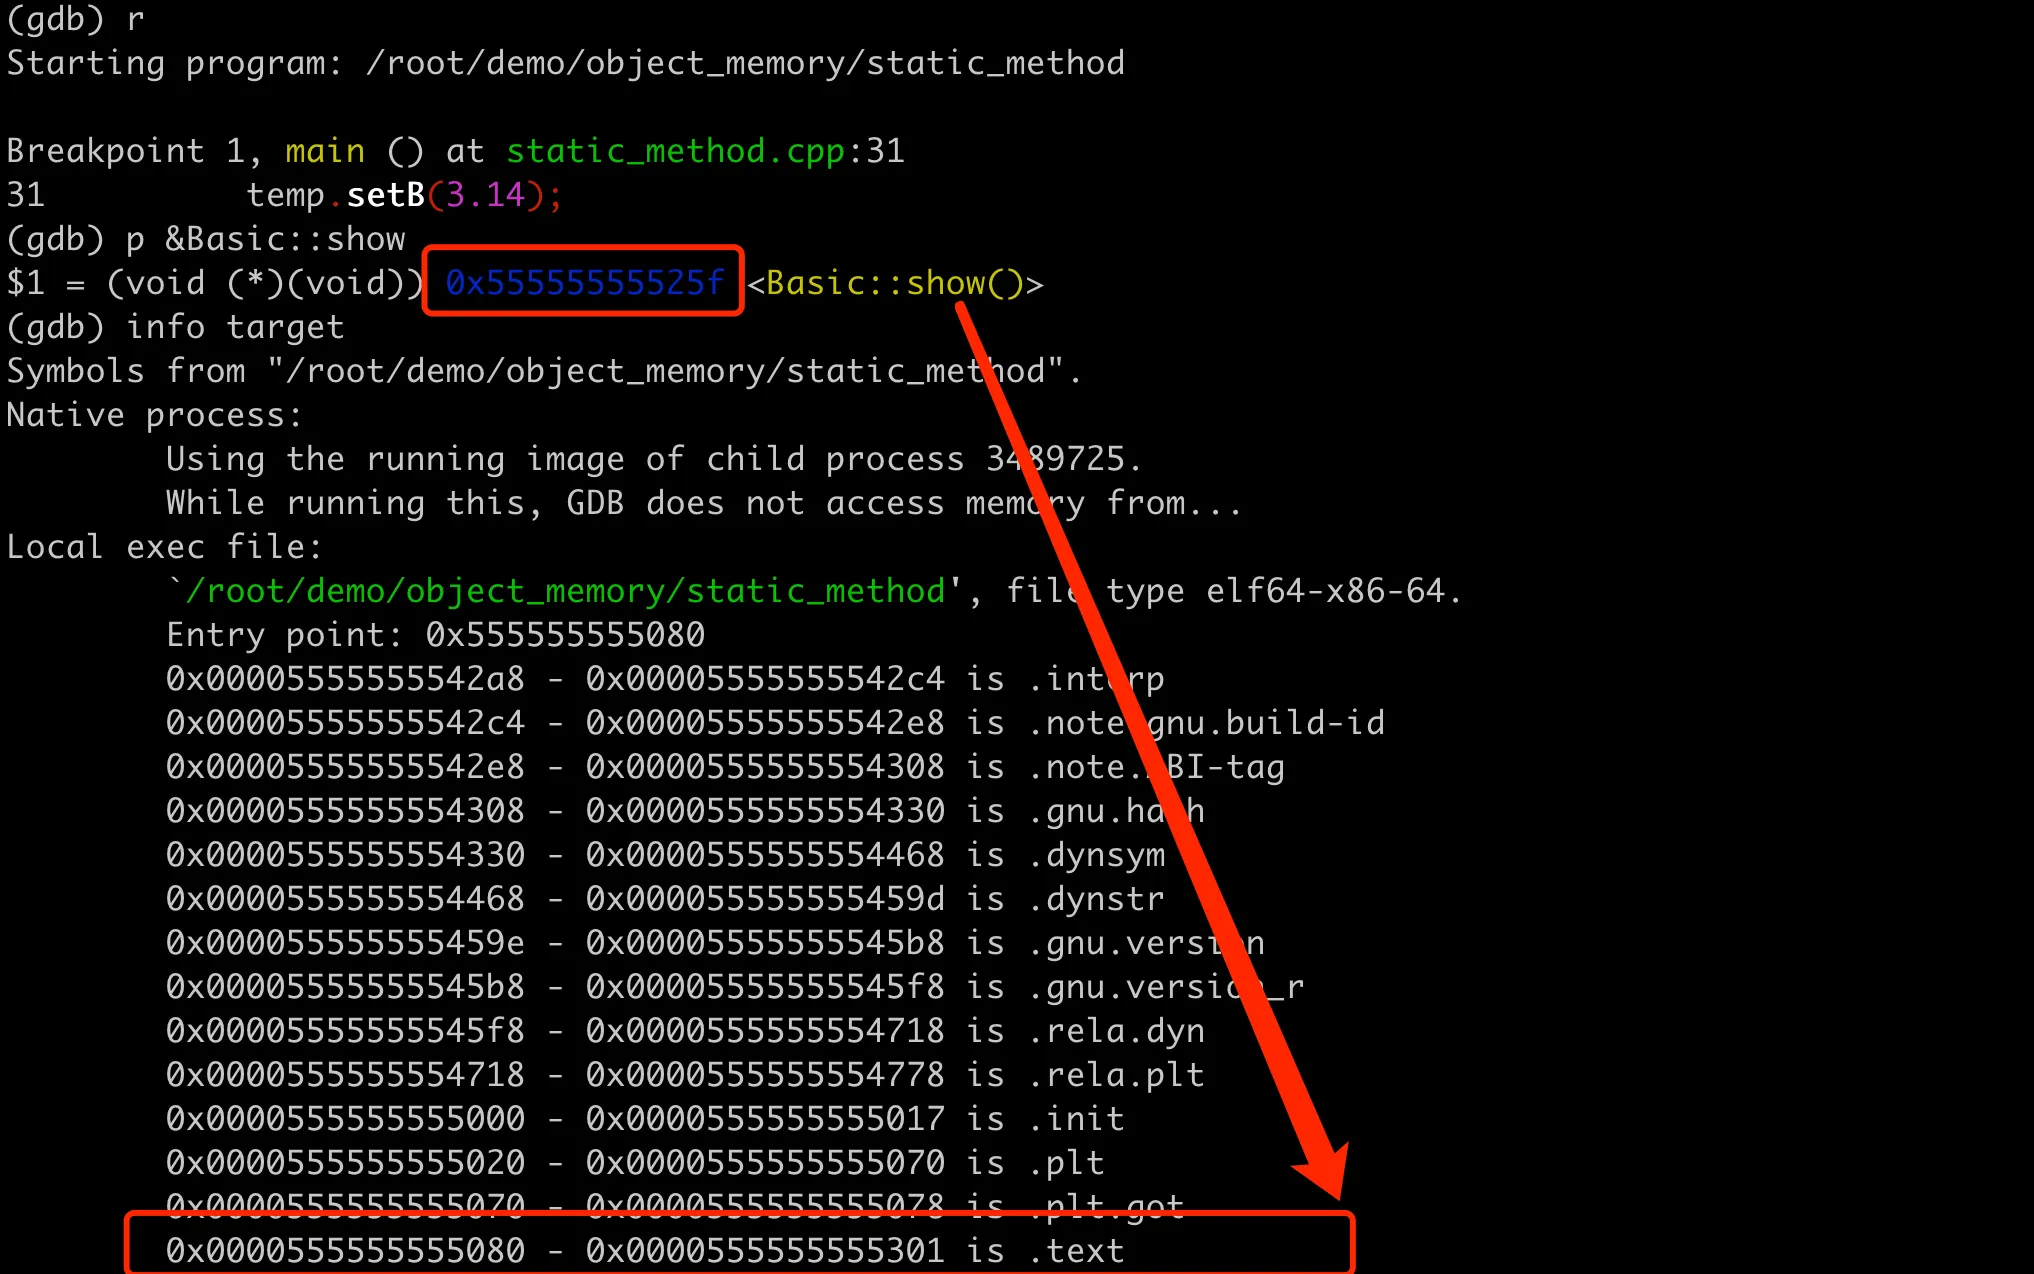
Recalling the memory layout of a process in Linux, the text segment (also called code segment) is the memory area that stores the program’s execution code, usually read-only to prevent accidental or malicious modification of its execution code during runtime. The address 0x5555555551d2 of the setB method here is located within the program’s text segment, which can be verified in GDB using info target:
 Member method stored in text segment
The address range of the .text segment is 0x0000555555555060 - 0x0000555555555251, and setB is just within this range. This answers the first question: member methods are stored in the process’s text segment, adding member methods does not change the memory layout size of class instance objects, and they do not occupy memory space of object instances.
Member Variable Addressing
So how does the member method obtain the address of member variables? Before solving this question, let’s take a closer look at the function prototype of setB (void (*)(Basic * const, double)). Here, the first parameter of the function is a Basic* pointer, while in the code, the call is like this: temp.setB(3.14). This usage is actually syntactic sugar; the compiler automatically passes the address of the current object as the this pointer to the function when calling member functions.
1 | (gdb) p &Basic::setB(double) |
The parameter passed here is the address of the object, but how is the address of member variable b obtained in the function? Let’s set a breakpoint at the place where setB is called, execute to the breakpoint, then step into the function, and examine the values of the corresponding registers and assembly code. The entire process is as shown in the following figure:
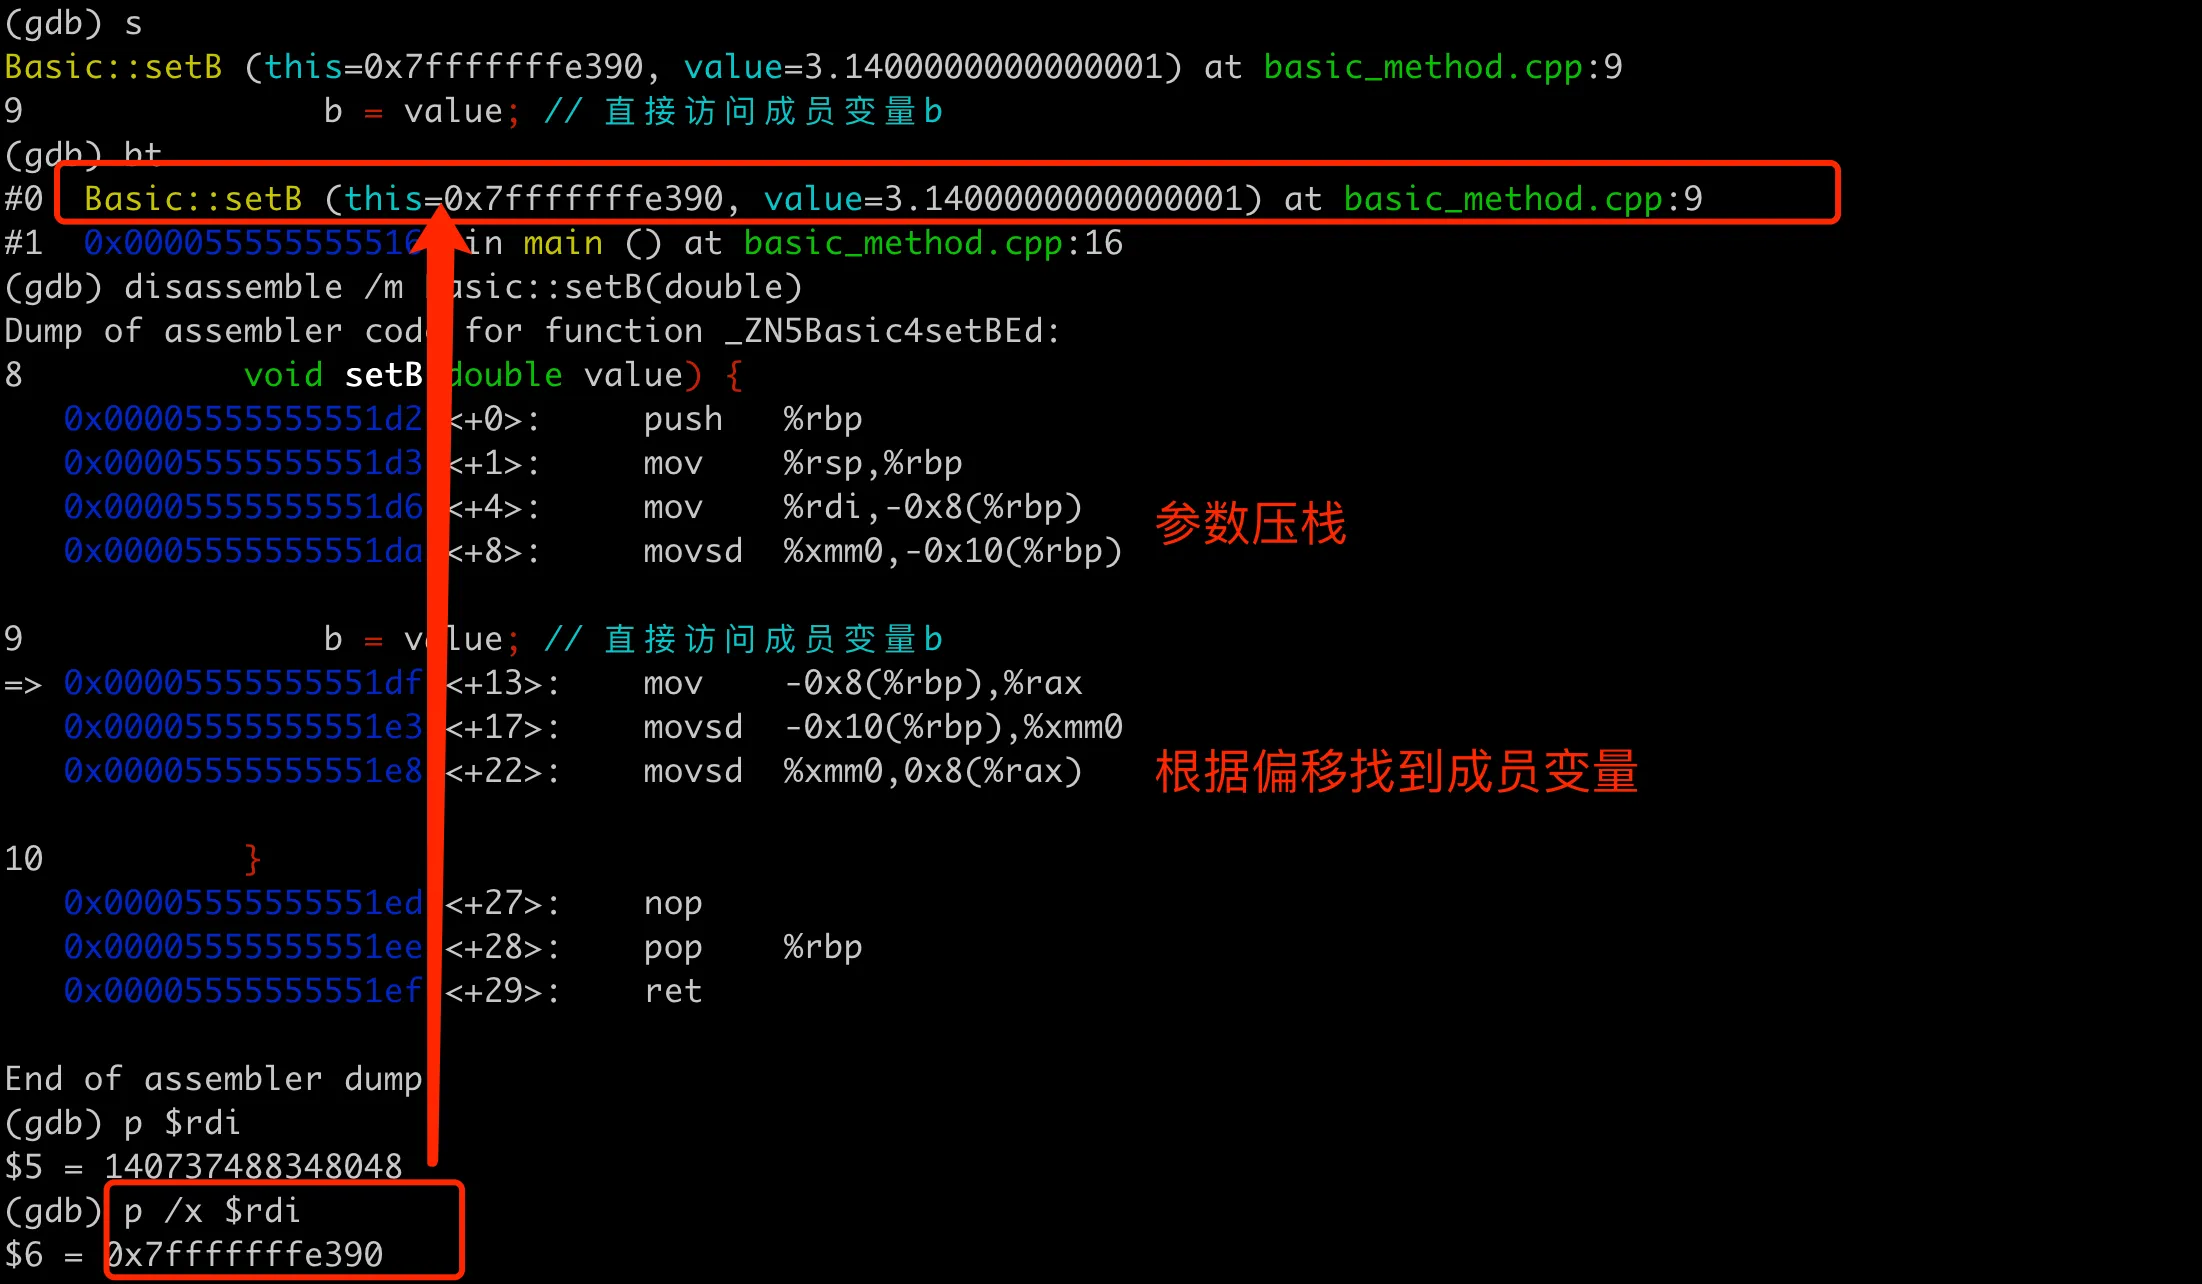 Assembly code for member method finding variable address
The assembly code here demonstrates how to access b through the this pointer and offset. It can be divided into two parts: the first part deals with the this pointer and parameters, and the second part finds the memory location of member b and then assigns the value.
Parameter passing part. Here mov %rdi,-0x8(%rbp) saves the this pointer (passed through the rdi register) onto the stack. The double type parameter value passed through the xmm0 register is saved onto the stack. This is the parameter passing convention for the GCC compiler on x86_64 machines. We can verify that it is indeed the starting address of the temp object by printing the address saved in $rdi.
Object assignment part. mov -0x8(%rbp),%rax loads the this pointer from the stack into the rax register. Similarly, movsd -0x10(%rbp),%xmm0 reloads the parameter value from the stack into the xmm0 register. movsd %xmm0,0x8(%rax) writes value to the b member of the this object. Here, 0x8(%rax) represents rax (i.e., the this pointer) plus an offset of 8 bytes, which is the position of member variable b in the Basic object.
When and how is this offset calculated? In fact, the address of a member variable relative to the object address is fixed; the actual address of a member variable is the object’s address plus the offset of the member variable within the object. The compiler calculates the offset of each member variable relative to the object’s starting address at compile time, based on the declaration order of member variables in the class definition and the compiler’s memory layout rules. Then at runtime, the accurate address of each member variable can be calculated by adding the base address (i.e., the object’s address) to the offset. This process is transparent to programmers and is automatically handled by the compiler and runtime system.
Function Call Convention and Optimization
In the assembly code above, both parameters of setB are first moved from registers to the stack, then from the stack back to registers for operation. Why move them back and forth unnecessarily? To answer this question, we need to understand function call conventions and register usage. In the system call convention of x86_64 architecture, the first few integer or pointer parameters are usually passed through registers (such as rdi, rsi, rdx, etc.), while floating-point parameters are passed through xmm0 to xmm7 registers. The purpose of this convention is to improve the efficiency of function calls, as passing parameters through registers is faster than using the stack.
Moving parameters from registers to the stack again is to ensure that the values in registers are not overwritten. Because registers are limited resources, they may be used multiple times for different purposes within a function. Saving values to the stack allows the function to freely use registers without worrying about overwriting the caller’s data.
Then, moving -0x8(%rbp) to the rax register and then writing to the member variable b’s value through movsd %xmm0,0x8(%rax), why not write directly from the xmm0 register to the offset address based on rbp? This is because the x86_64 instruction set and its operation mode usually support accessing data using register indirect addressing mode. Using general-purpose registers like rax as an intermediate step is a more universal and compatible method.
Of course, the above compilation process did not enable compilation optimization, so the compiler adopted a direct but inefficient code generation strategy, including frequently moving parameters and local variables between the stack and registers. The compiler’s optimization strategy may affect how parameters are handled. If we enable compilation optimization, like this:
1 | g++ basic_method.cpp -o basic_method_O2 -O2 -g -std=c++11 |
The generated assembly part of the main function is as follows:
1 | (gdb) disassemble /m main |
At the O2 optimization level, the compiler determined that all operations in the main function (including creating the Basic object and assigning values to its member variables) have no effect on the program’s final result, so they were all optimized away. This is the compiler’s “dead code elimination“, which directly removes parts of the code that do not affect the program’s output.
Special Member Memory Distribution
The members above are all public. What about private variables and private methods? Additionally, how are static member variables or static member methods laid out in memory?
Private Members
Let’s first look at private members, continuing from the previous example, adding private member variables and methods. The overall code is as follows:
1 |
|
After compilation, using GDB, we can print out the addresses of all member variables and find that there’s nothing special about the memory layout of private variables; they are also stored sequentially in the object. Private methods also have nothing special; they are stored in the text segment as well. The overall layout is as follows:
 Memory layout with private members
So how is visibility control implemented for private members? First, there is definitely protection at compile-time, which is easy to verify. We cannot directly access temp.c or call the secret method, as it would result in a compilation error.
Is there protection at runtime? Let’s verify this. We have already verified that private member variables are also found at memory locations based on offsets. We can directly find the memory location based on the offset in the code and change the value inside.
1 | int* pC = reinterpret_cast<int*>(reinterpret_cast<char*>(&temp) + 16); |
After this modification, we can add a show method to print the values of all members and find that temp.c has indeed been changed to 12. It seems that member variables have no restrictions at runtime; they can be read and written by bypassing the compiler’s restrictions if the address is known. What about private methods?
Private methods, like ordinary member methods, are stored in the text segment. Can we call them through this address after obtaining their address? This requires some tricky operations. We need to add an additional interface in the class definition to expose the address of the private member method, and then call the private member method through a member function pointer. The overall code is as follows:
1 | class Basic { |
The above code runs normally; you can verify by printing the values of member variables before and after the call. It seems that for member functions, they are only prevented from being directly called at compile-time, with no protection at runtime. We can bypass the compilation restriction to call them from outside the object.
Of course, in actual development, never directly access private member variables through address offsets, and don’t use various tricky operations to access private member methods. This not only breaks the encapsulation of the class but is also unsafe.
Static Members
Everyone familiar with C++ class static members knows that static member variables are shared among all instances of the class. No matter how many objects of the class you create, there is only one copy of the static member variable. The lifecycle of static member variables begins from the moment they are defined until the program ends. Static member methods do not depend on any instance of the class to execute and are mainly used in factory methods, instance acquisition methods for singleton patterns, or other utility functions unrelated to specific instances of the class.
Let’s look at the memory layout and implementation characteristics of static member variables and static member methods with a specific example. Continuing from the previous code example, we’ll omit other irrelevant code here.
1 |
|
Simply printing the addresses of temp and alias, we find a significant difference between the two. The address of temp is 0x7fffffffe380, while Basic::alias is 0x555555558048. Using info target, we can see that alias is within the program’s .data memory space range 0x0000555555558038 - 0x000055555555804c. This further confirms that the .data segment is used to store initialized global variables and static variables, note that this needs to be non-zero initial values.
For global variables or static variables that are not initialized or initialized to zero, they are stored in the .bss segment. This is also easy to verify. If we set the value of alias above to 0 and check the memory location again, we can see that it is indeed in the .bss segment. For global variables or static variables, why do they need to be stored in these two separate segments instead of merging them into one segment?
The main consideration here is binary file disk space size and loading efficiency. On disk, .data occupies actual disk space because it needs to store specific initial value data. The .bss segment does not occupy actual storage space; it only needs the operating system to allocate and zero out the corresponding memory when the program is loaded. This can reduce the size of the executable file. During program startup, the operating system can quickly allocate memory for the .bss segment and initialize it to zero without having to read a large amount of zero-value data from disk, which can improve the loading speed of the program. For a more detailed explanation, you can refer to Why is the .bss segment required?.
How are static methods implemented? Let’s first output the memory address and find that it’s in the .text code segment, which is the same as other member methods. However, unlike member methods, the first parameter is not the this pointer. In implementation, it is similar to ordinary global functions, with the main difference being that their scope is limited to the class they belong to.
 Implementation and memory layout of static method
Memory Layout of Class Inheritance
Of course, since we’re talking about object-oriented classes, we can’t miss inheritance. Let’s look at the memory layout of classes in inheritance situations from specific examples.
Inheritance Without Virtual Functions
First, let’s look at inheritance without virtual functions. The example code is as follows:
1 |
|
After compiling and running, using GDB to print the memory distribution of member variables, we find that the layout of Derived class objects in memory first includes all member variables of its base class Basic, followed by Derived class’s own member variables. The overall layout is as follows:
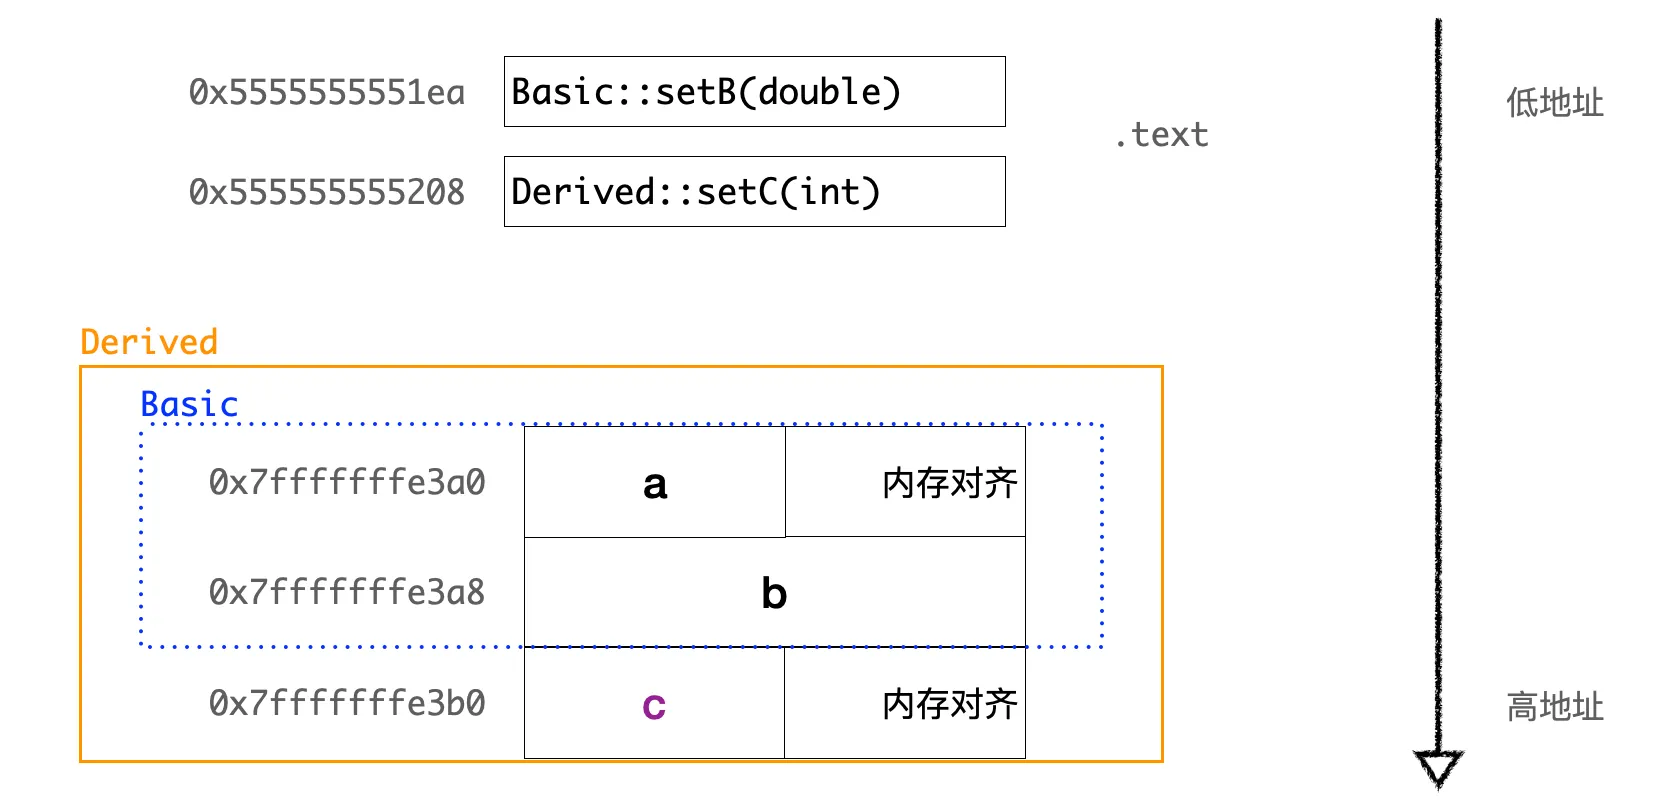 Memory layout of inherited class
In fact, the C++ standard does not specify the arrangement order between base class and derived class member variables in inheritance, and compilers can implement it freely. But most compilers implement it with the base class’s member variables before the derived class’s member variables. Why do it this way? Because this implementation makes the object model simpler and more intuitive. Whether it’s a base class or a derived class, the memory layout of objects is continuous, simplifying the implementation of object creation, copying, and destruction operations. When we access base class members through a derived class object, it’s completely consistent with directly using a base class object. The first half of a derived class object is a complete base class object.
For member functions (including ordinary functions and static functions), they do not occupy memory space in object instances. Whether they are base class member functions or derived class member functions, they are all stored in the program’s code segment (.text segment).
Inheritance with Virtual Functions
Inheritance with virtual functions is a bit more complex. Based on the previous inheritance example, let’s add a virtual function and then call it polymorphically in main.
1 |
|
In the above code, the line Basic* ptr = &derivedObj; uses a base class pointer to point to a derived class object. When calling the virtual function through the base class pointer ptr->printInfo();, it will be resolved at runtime to the Derived::printInfo() method, which is runtime polymorphism. For the ptr->printB(); call, since the derived class doesn’t define a printB() method, it will call the base class’s printB() method.
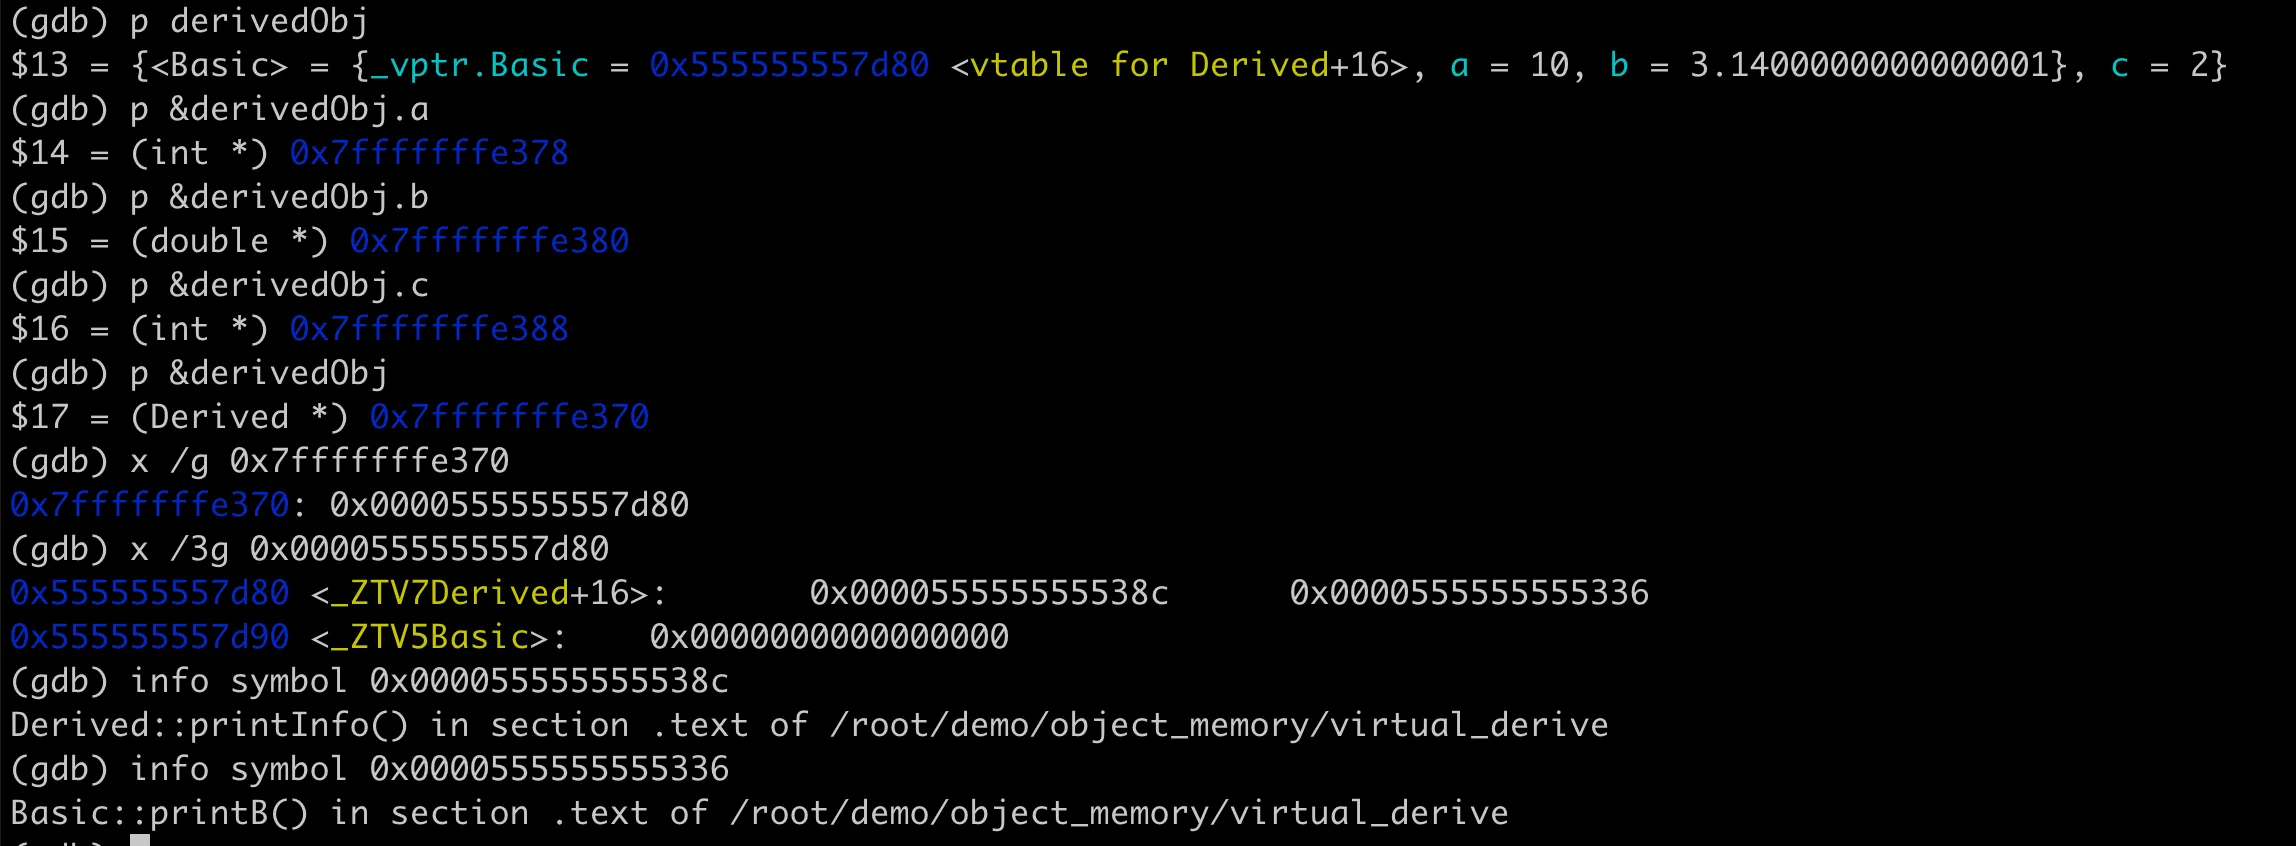
So what does the object’s memory layout look like in the case of inheritance with virtual functions? How is the polymorphic call of virtual functions implemented? Practice makes perfect. We can use GDB to examine the object’s memory layout, and based on this, we can verify the virtual function table pointer, virtual function table, and implementation details of polymorphic calls. Let’s first look at the memory layout of the Derived class object, as shown in the following figure:
 Memory layout of inherited class with virtual functions
We can see that at the beginning of the derived class object (at address 0x7fffffffe370), there is an 8-byte virtual function table pointer vptr (pointer address 0x555555557d80). This pointer points to a virtual function table (vtable), which stores the addresses of virtual functions. There are two addresses 0x55555555538c and 0x555555555336, corresponding to the two virtual functions printInfo and printB in the Derived class. The situation for the base class is similar. The following diagram illustrates this more clearly:
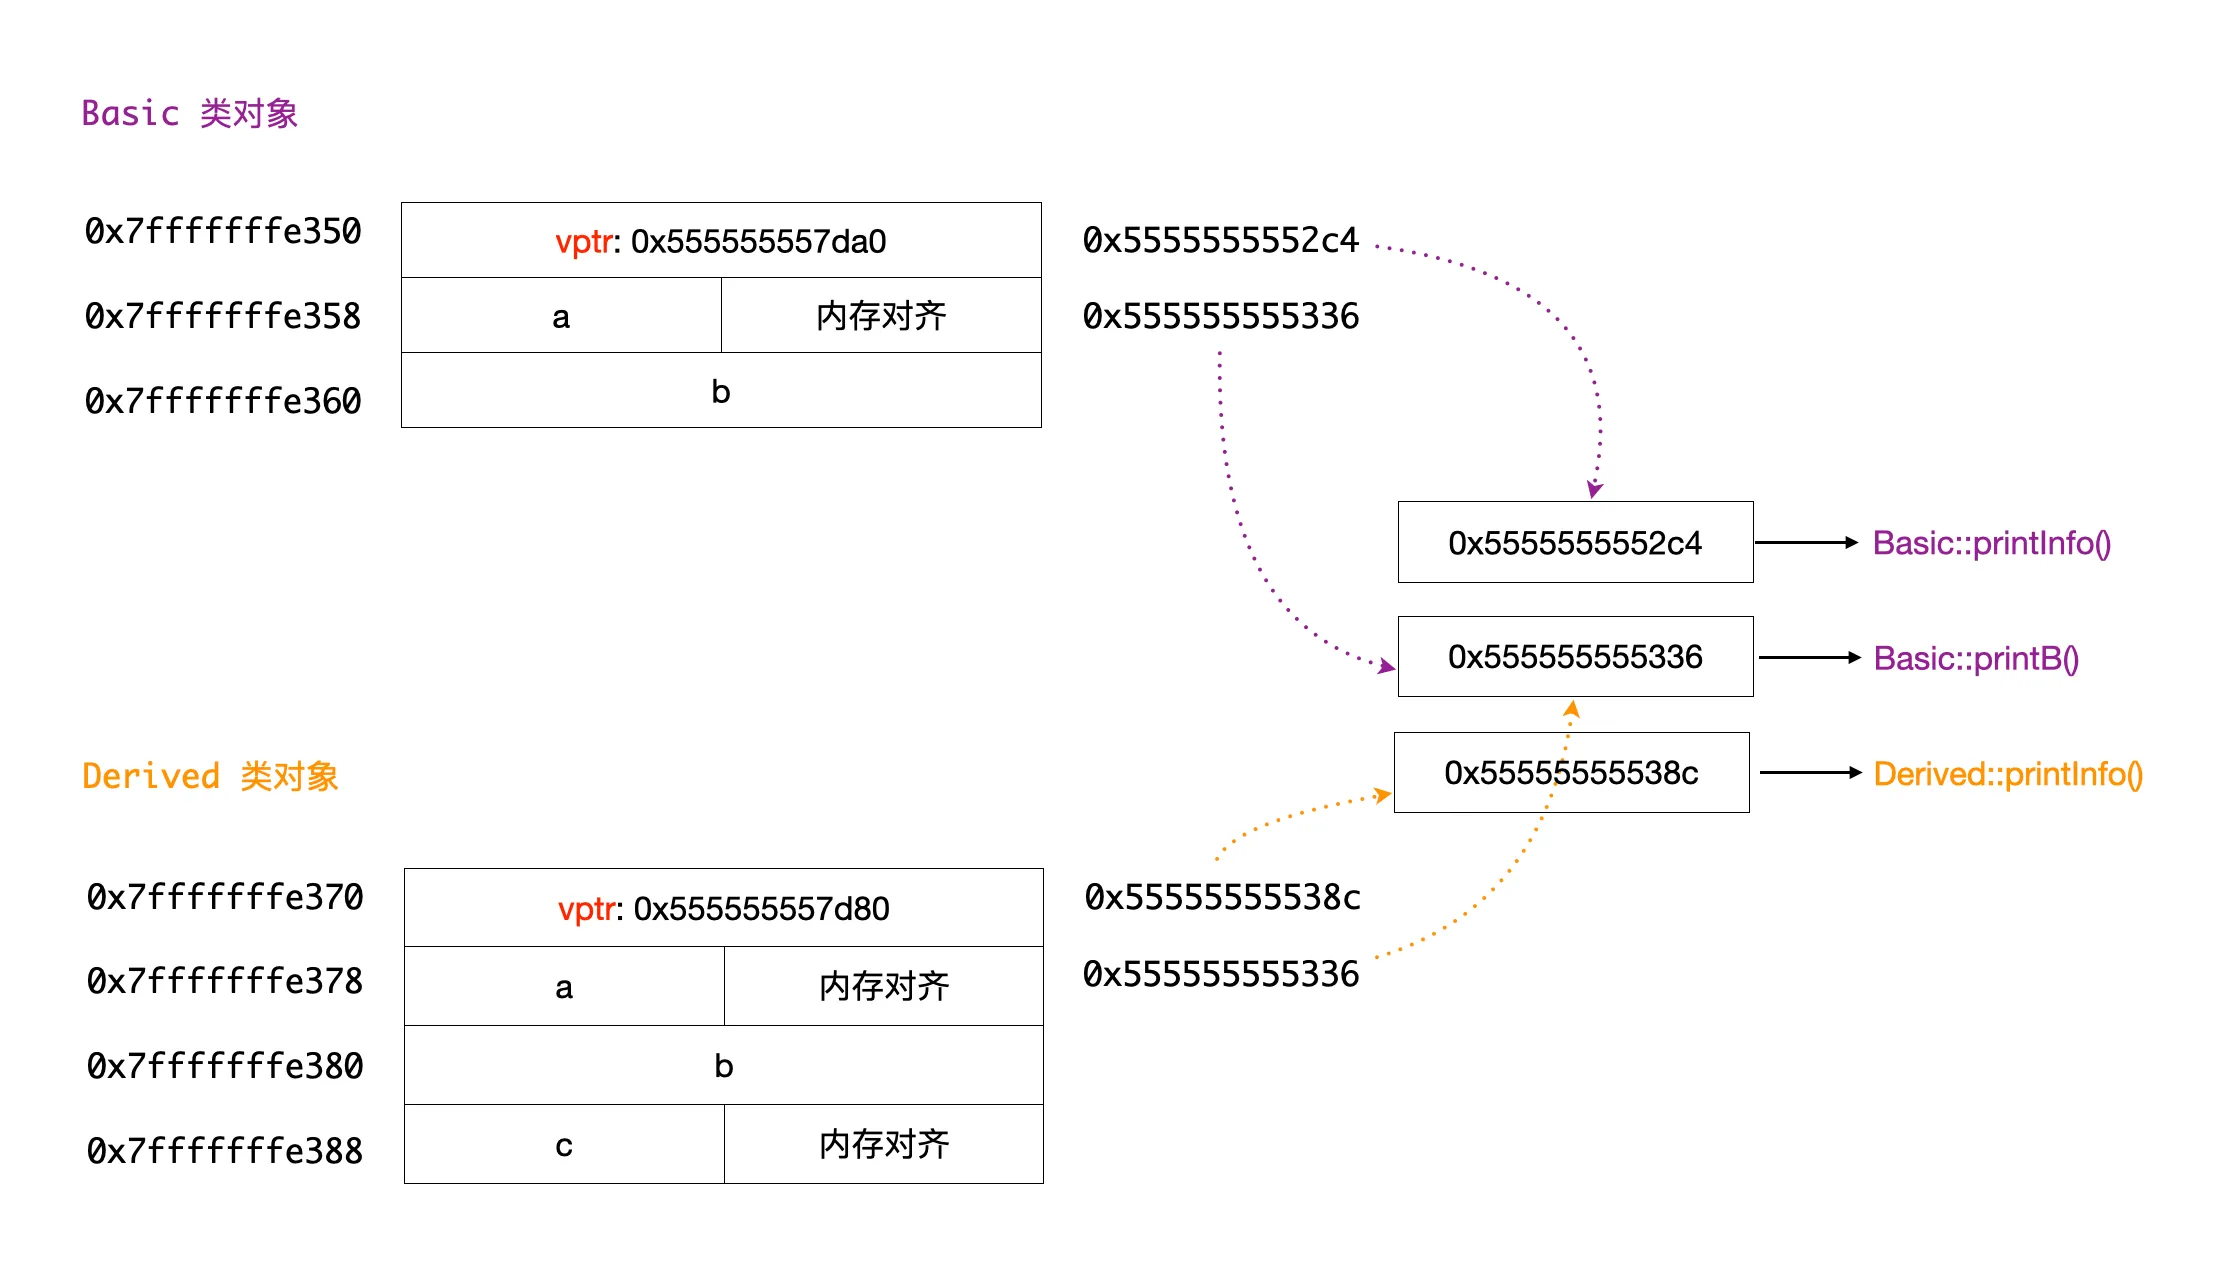 Schematic diagram of memory layout for inherited class with virtual functions
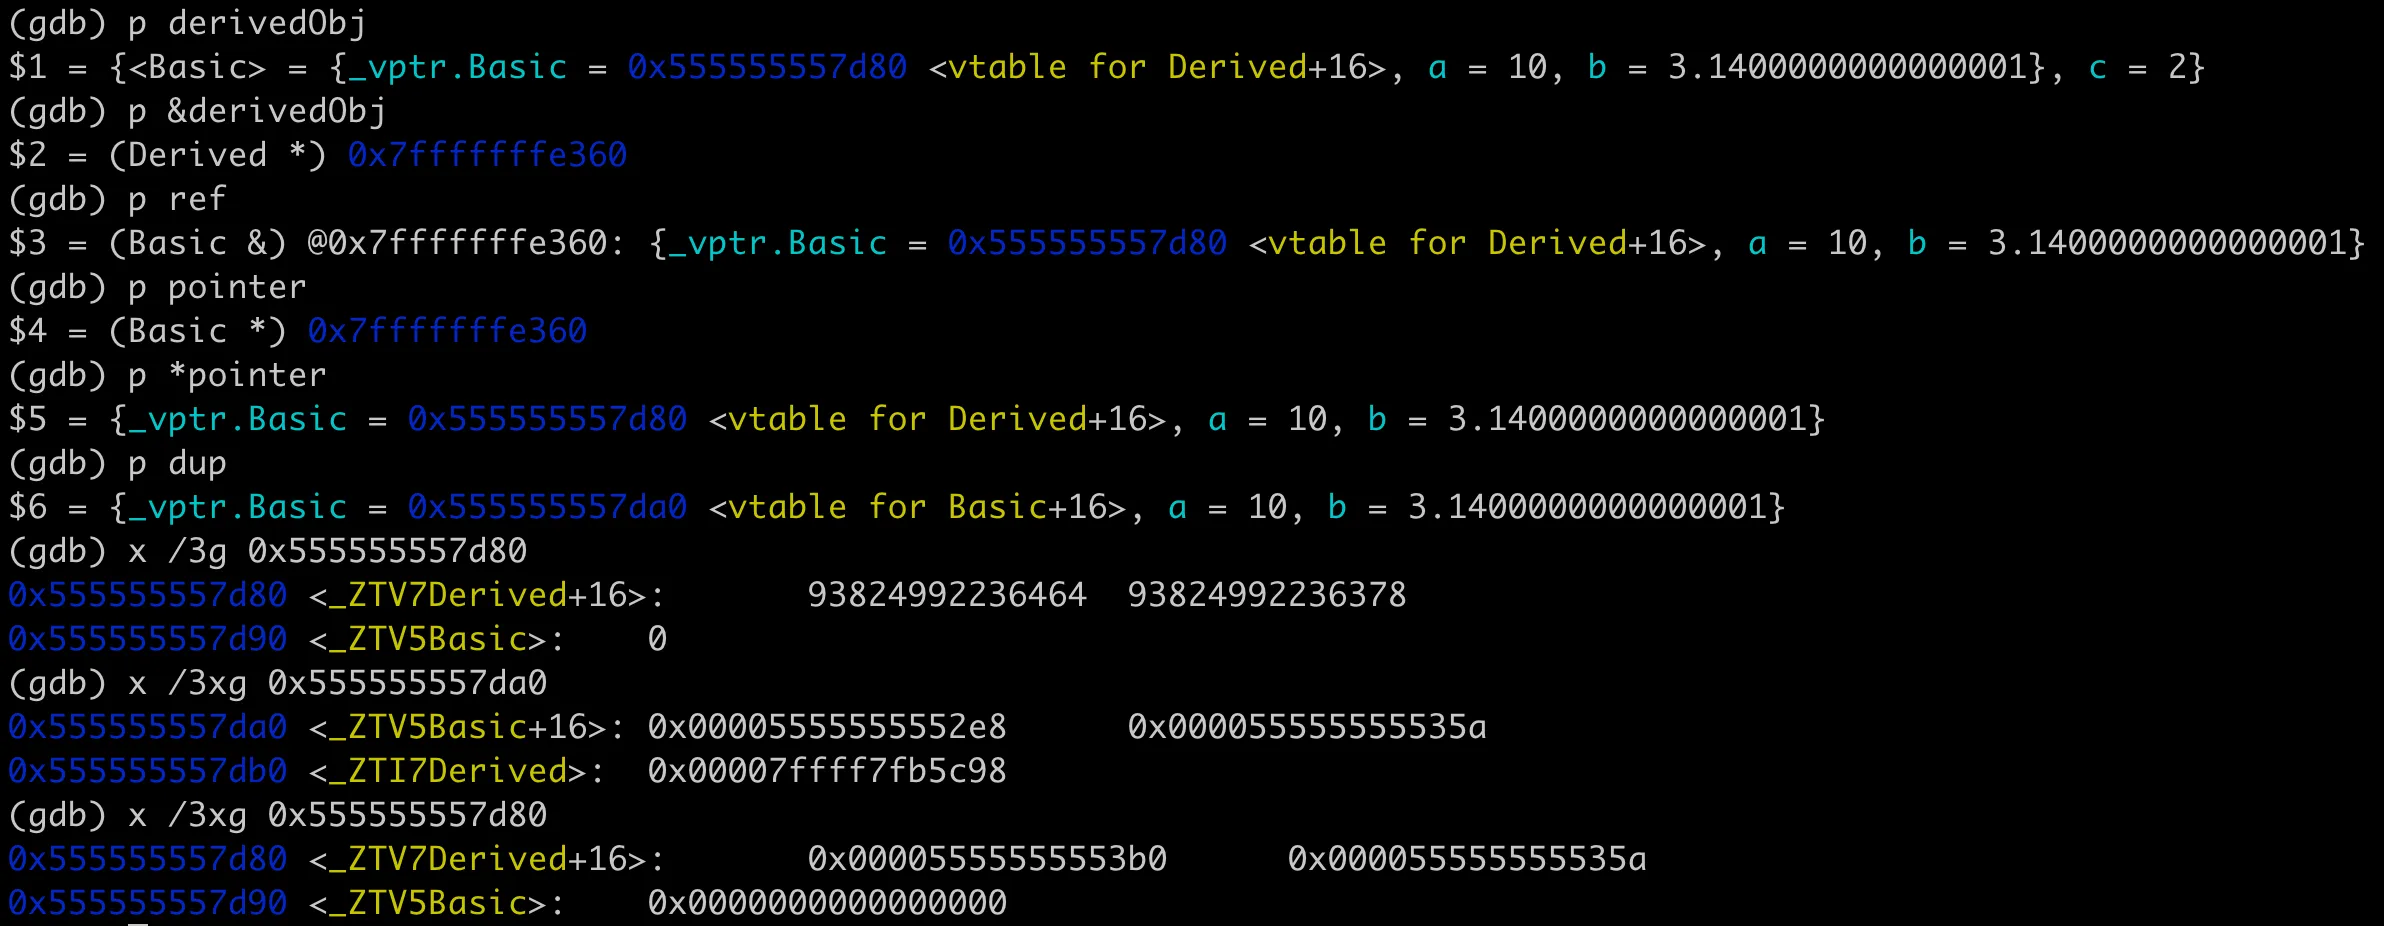
Now we’ve clarified the memory layout of virtual functions in class objects. In compiler implementation, the virtual function table pointer is part of each object instance, occupying memory space in the object instance. For an instance object, its corresponding virtual function table can be found through its address, and then the specific virtual function address can be found through the virtual function table, implementing polymorphic calls. So why must polymorphic calls be implemented through references or pointers? Look at the following 3 calls, the last one cannot implement polymorphic calls.
1 | Basic& ref = derivedObj; |
Let’s use GDB to look at the memory layout of these three objects, as shown in the following figure:
 Memory layout differences of 3 types of objects, deep understanding of polymorphism
There’s no difference between pointers and references at the compiler’s underlying level. The addresses of ref and ptr are the same, which is the address of the original derived class derivedObj 0x7fffffffe360. The virtual function table pointer inside points to the derived class’s virtual function table, so it can call the derived class’s printInfo. The dup here is generated through the copy constructor, where the compiler performed an implicit type conversion, truncating the base class part from the derived class to generate a base class object. The virtual function table pointer in dup points to the base class’s virtual function table, so it calls the base class’s printInfo.
From the output of the dup virtual function table pointer, we can also see that the virtual function table doesn’t need one copy per instance; all object instances can share the same virtual function table. The virtual function table is one per polymorphic class, created by the compiler at compile time.
Of course, this is the implementation of polymorphism by the Clang compiler on the Mac platform. The C++ standard itself does not specify the implementation details of polymorphism; it doesn’t say that virtual function tables (vtables) and virtual function table pointers (vptrs) must be used to implement it. This is because the C++ standard focuses on behavior and semantics, ensuring that we get the correct behavior when using polymorphic features, but it doesn’t specify the underlying memory layout or specific implementation mechanism. These details are usually decided by the compiler’s implementation.
Different compilers might implement it differently. Many compilers, for efficiency of access, place the virtual function table pointer at the beginning of the object’s memory layout. This way, the call to virtual functions can quickly locate the virtual function table and then find the corresponding function pointer. If a class has multiple inheritances, the situation might be more complex, and some compilers might adopt different strategies to arrange the positions of virtual function table pointers, or an object might have multiple virtual function table pointers.
Address Space Layout Randomization
In the previous examples, if you run the program multiple times with GDB, the virtual memory addresses of objects are the same each time. Why is this?
We know that in modern operating systems, each running program uses a virtual memory address space, which is mapped to physical memory through the operating system’s memory management unit (MMU). Virtual memory has many advantages, including improving security and allowing more flexible memory management. To prevent security vulnerabilities such as buffer overflow attacks, operating systems will also randomize the process’s address space layout each time the program starts. This is called Address Space Layout Randomization (ASLR).
On Linux operating systems, you can check whether the current system’s ASLR is enabled by using cat /proc/sys/kernel/randomize_va_space. It’s basically enabled by default (value is 2); if it’s 0, it’s disabled.
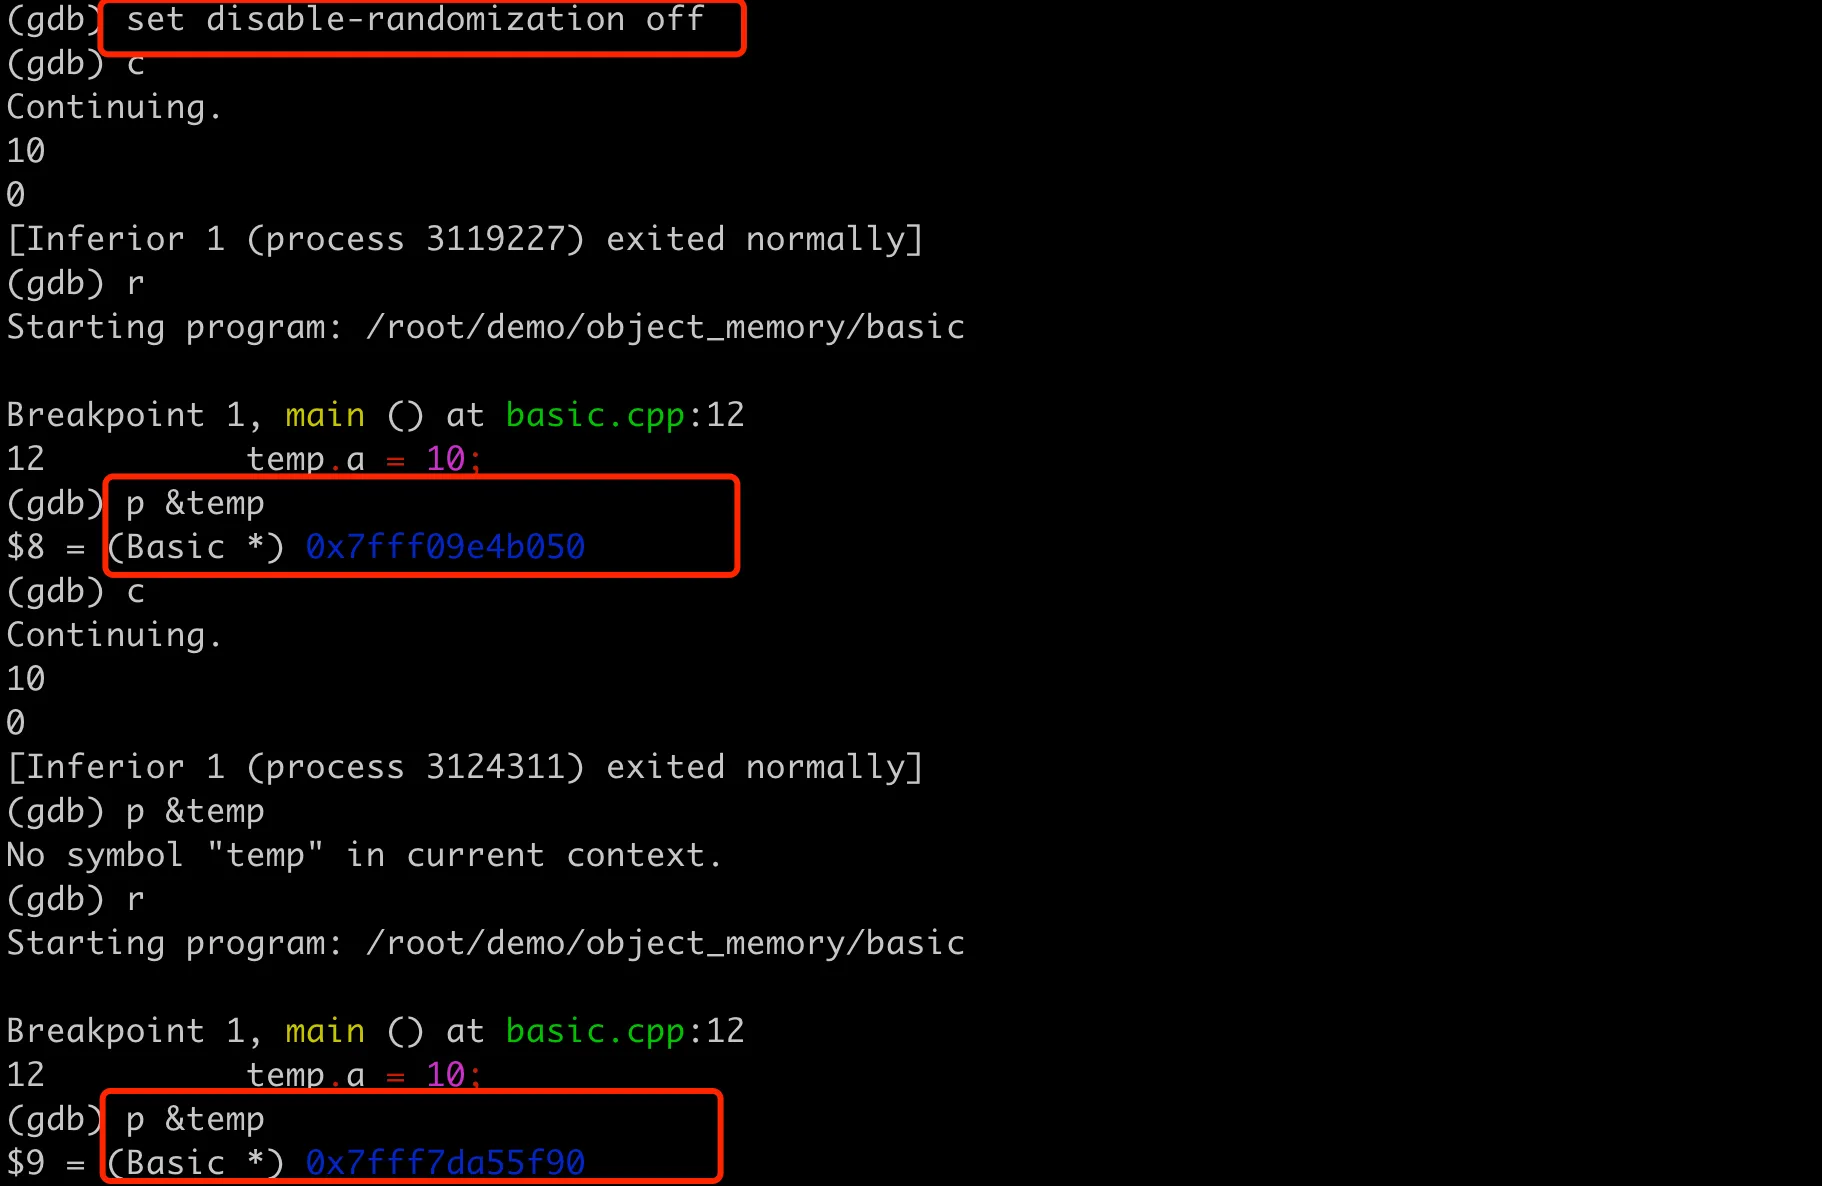
The reason we observed fixed memory addresses when using GDB for debugging earlier is that GDB disables ASLR by default to make it easier to reproduce problems during debugging. You can enable ASLR when using GDB to make the debugging environment closer to the actual running environment. After starting GDB, you can enable address space randomization with the following command:
1 | (gdb) set disable-randomization off |
After that, if you run multiple times, the addresses here will change.
 GDB enabling address space layout randomization
Conclusion
The C++ object model is a complex topic, involving class memory layout, access to member variables and member functions, inheritance, polymorphism, and many other aspects. This article starts from practical examples to help everyone gain an intuitive understanding of C++ object memory layout.
To briefly summarize the core conclusions of this article:
- The memory layout of objects is continuous, with member variables stored in the object in the order of declaration. The compiler calculates the offset of each member variable relative to the object’s starting address based on the class definition.
- Member methods are stored in the process’s text segment and do not occupy memory space in object instances. They access member variables through the this pointer and offsets.
- Private member variables and methods have no protection at runtime and can be read and written by bypassing compiler restrictions through address offsets, but this is not recommended.
- Static member variables and static member methods are stored in the program’s data segment and code segment, not occupying memory space in object instances.
- For inherited class memory layout, compilers generally place base class member variables before derived class member variables, making the object model simpler and more intuitive.
- For inheritance with virtual functions, the object’s memory layout includes a virtual function table pointer, and polymorphic calls are implemented through the virtual function table. The implementation of virtual functions is quite complex; here we only consider simple single inheritance.
- Address Space Layout Randomization (ASLR) is a security feature of modern operating systems that can effectively prevent security vulnerabilities such as buffer overflow attacks. GDB disables ASLR by default, but you can enable address space randomization with the
set disable-randomization offcommand.
Of course, this article is just an introductory-level presentation. For more in-depth content, you can refer to the book “Inside the C++ Object Model”.

