LevelDB Explained - Implementation and Optimization Details of Key-Value Writing

LevelDB provides a Put interface for writing key-value pairs, which is one of the most important operations in a KV database. The usage is straightforward:

1
2
leveldb::Status status = leveldb::DB::Open(options, "./db", &db);
status = db->Put(leveldb::WriteOptions(), key, value);

One of LevelDB’s greatest advantages is its extremely fast write speed, supporting high concurrent random writes. The official write performance benchmark shows:

1
2
3
4
fillseq      :       1.765 micros/op;   62.7 MB/s
fillsync : 268.409 micros/op; 0.4 MB/s (10000 ops)
fillrandom : 2.460 micros/op; 45.0 MB/s
overwrite : 2.380 micros/op; 46.5 MB/s

As we can see, without forced disk synchronization, random write speed reaches 45.0 MB/s, supporting about 400,000 writes per second. With forced disk synchronization, although the write speed decreases significantly, it still maintains around 0.4 MB/s, supporting about 3,700 writes per second.

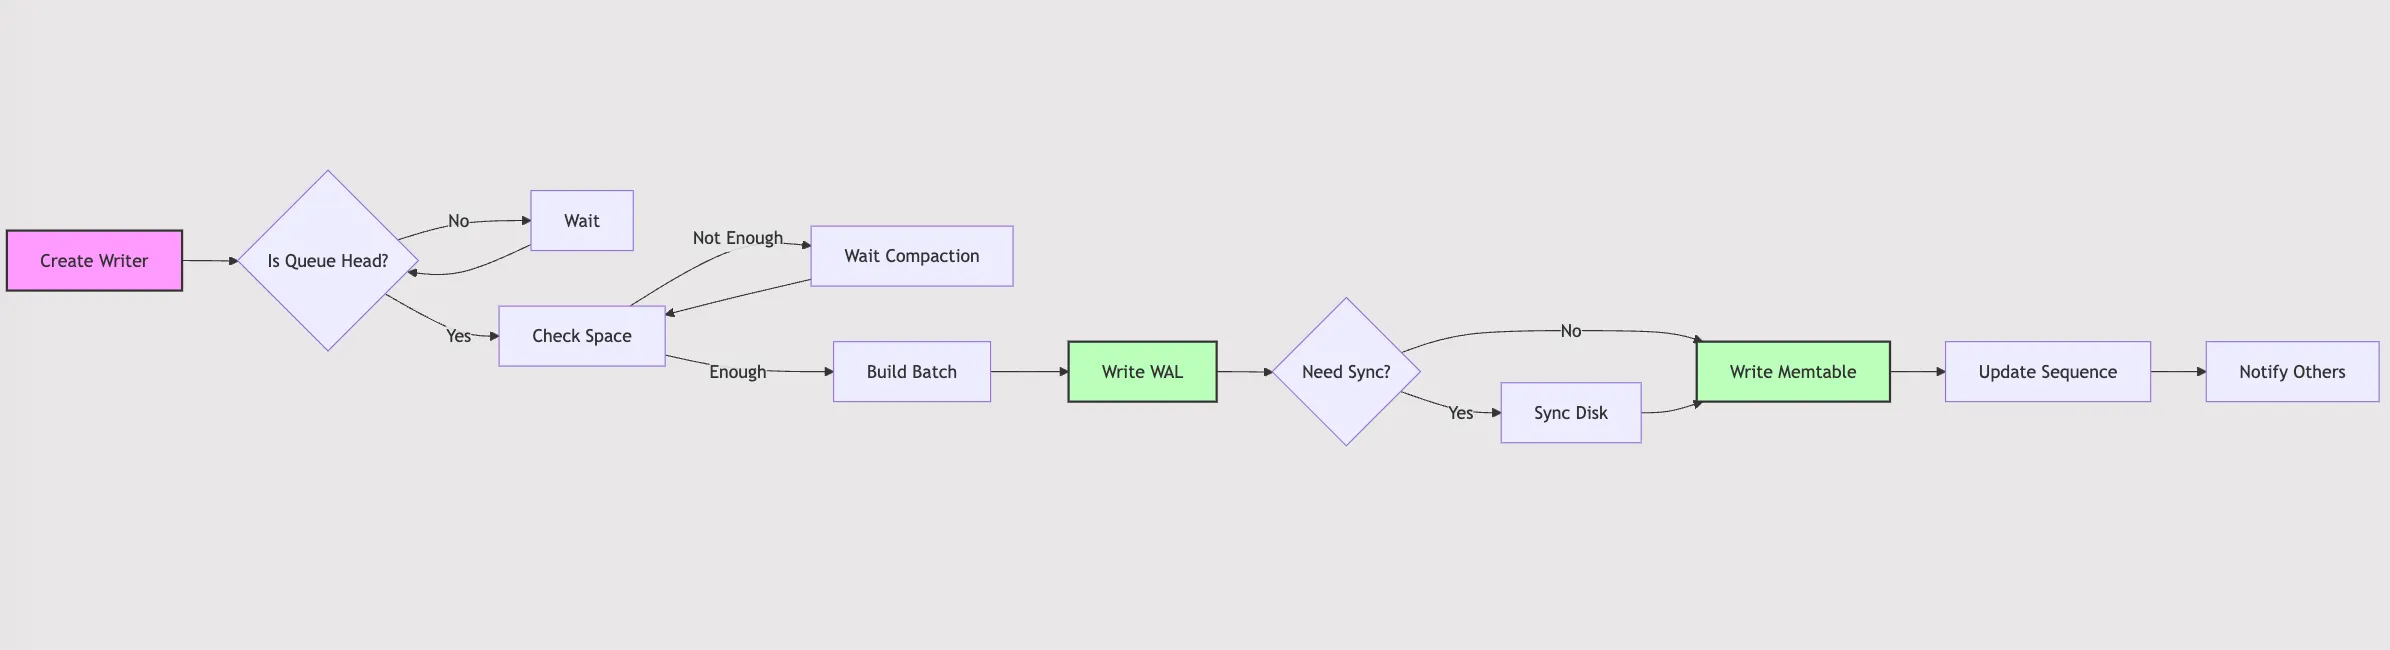
What exactly happens behind the Put interface? How is data written? What optimizations does LevelDB implement? Let’s explore these questions together. Before we begin, let’s look at an overview flowchart:

LevelDB Write Process Overview

Read More

LevelDB Explained - Elegant Merging of Write and Delete Operations

LevelDB supports both single key-value writes and batch writes. These two types of operations are essentially handled the same way - they’re both encapsulated in a WriteBatch object, which helps improve write operation efficiency.

In LevelDB, WriteBatch is implemented using a simple data structure that contains a series of write operations. These operations are serialized (converted to byte streams) and stored in an internal string. Each operation includes an operation type (such as insert or delete), key, and value (for insert operations).

When a WriteBatch is committed to the database, its contents are parsed and applied to both the WAL log and memtable. Regardless of how many operations a WriteBatch contains, they are processed and logged as a single unit.

Read More

5 Real-world Cases of C++ Process Crashes from Production

If you’ve worked on any non-trivial C++ project, you’ve likely encountered process coredumps. A coredump is a mechanism where the operating system records the current memory state of a program when it encounters a severe error during execution.

There are many reasons why a C++ process might coredump, including:

  1. Illegal Memory Access: This includes dereferencing null pointers, accessing freed memory, array bounds violations, etc.
  2. Stack Overflow: Caused by infinite recursion or large arrays allocated on the stack
  3. Segmentation Fault: Attempting to write to read-only memory or accessing unmapped memory regions
  4. Uncaught Exceptions: Program termination due to unhandled exceptions

When encountering a coredump, we typically need to examine the core file for problem analysis and debugging. Analyzing core files can be challenging as it requires a deep understanding of C++’s memory model, exception handling mechanisms, and system calls.

Rather than focusing on core file analysis methods, this article will present several real-world cases to help developers proactively avoid these errors in their code.

Read More